AUCTORES
Globalize your Research

Research Article | DOI: https://doi.org/10.31579/2637-8914/174
Chemistry Department (Analytical Unit), Ekiti State University, Ekiti State, Ado-Ekiti, Nigeria.
*Corresponding Author: Emmanuel Ilesanmi Adeyeye, Chemistry Department (Analytical Unit), Ekiti State University, Ekiti State, Ado-Ekiti, Nigeria.
Citation: Emmanuel Il. Adeyeye, (2024), Effects of Fermentation and Germination on Raw Whole-wheat Grain of Triticum durum in the Evaluation of Its Proximate, Minerals and Antinutrients Composition, J. Nutrition and Food Processing, 7(1); DOI:10.31579/2637-8914/174
Copyright: © 2024, Emmanuel Ilesanmi Adeyeye. This is an open access article distributed under the Creative Commons Attribution License, which permits unrestricted use, distribution, and reproduction in any medium, provided the original work is properly cited.
Received: 17 November 2023 | Accepted: 15 January 2024 | Published: 23 January 2024
Keywords: whole-wheat; triticum durum, raw; processing; chemical composition
Background: This work reports on the effects of processing on food composition of Triticum durum grown in Nigeria.
Methods: Standard methods were used to determine proximate, minerals and antinutrients levels in raw (RS), fermented (FS) and germinated (GS) samples of T. durum.
Results: Protein was enhanced in GS, crude fat in FS and GS whereas fibre was reduced in FS and GS and ash in FS. Water balance for protein metabolism were (ml): RS (579) > FS (576) < GS (630). Mineral reduction due to treatment can be seen as follows (mg/100g): RS (266.6) > GS (242.21) > FS (241.59). Major enhanced minerals during processing: Zn, Mn, and Na. Among the mineral ratios, [K/(Ca+Mg)] had values between 2.96-3.00 which were higher than the reference ideal balance of 2.20. In MSI for Na, Ca, Mg, Zn, Fe and P, only Zn had values greater than standard MSI indicating no deleterious effects in all the samples (except Zn). Processing highly reduced the antinutrients. Enhancement occurred in tannic acid, RS/FS (30.6), RS/GS (14.5), FS/GS (12.3). Significant differences (rc=0.01) existed; pairs RS/FS, RS/GS, FS/GS for proximate, mineral, antinutrient and molar ratios.
Conclusion: In the areas of food functionality, importance would be GS > FS > RS.
Wheat is a grass which is widely cultivated for its seed, a cereal grain which is a worldwide staple food [1,2,3]. There are many species of wheat and they together make up the genus Triticum; the most grown of them being the common wheat (Triticum aestivum). Botanically, wheat kernel is a type of fruit called a caryopsis. The three major types of wheat are Triticum vulgare (or aestivum), T. durum, and T. compactum.
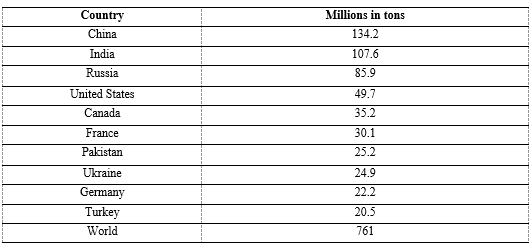
Wheat is grown on more land area than any other food crop (220.4 million hectares or 545 million acres, 2014) [4]. World trade in wheat is greater than for all other crops combined [5]. In 2020, world production of wheat was 761 million tonnes (1.7 trillion pounds), making it the second most produced cereal after maize [6] (Table 1). World demand for wheat has continued to increase because of its unique viscoelastic and adhesive properties of gluten proteins that facilitate the production of processed foods, whose consumption is increasing as a result of the worldwide industrialization and the westernization of the diet [7, 8].
Table 1: Top wheat producers in 2020
Wheat is an important source of carbohydrate [7]. It is the leading source of vegetable protein in human food globally, having protein content of about 13%, which is relatively high compared to other major cereal [9] although relatively low in protein quality for supplying essential amino acids [10,11]. As a whole grain, wheat is a source of multiple nutrients and dietary fibre [7]. Raw wheat can be ground into flour or, using hard durum wheat only, can be ground into semolina; germinated and dried creating malt; parboiled (or steamed), dried, crushed and de-branned into bulghur also called groats [12]. Wheat is a major ingredient in such foods as bread, porridge, crackers, biscuits, muesli, pancakes, pasta and noodles, pies, pastries, pizza, semolina, cakes, cookies, muffins, rolls, doughnuts, gravy, beer, vodka, boza (a fermented beverage) and breakfast cereals [13].
Major cultivated species of wheat are: Hexaploid species-Common wheat or bread wheat (Triticum aestivum) [14]. Tetraploid species- Durum (Triticum durum); a tetraploid form of wheat widely used today, and the second most widely cultivated wheat [14]. Some methods used in naming wheat which are based on special characteristics are: protein content (e.g bread wheat); the quality protein content (e.g. bread wheat); the quality of the wheat protein gluten (determines use of protein in a particular dish; e.g. strong and elastic gluten in bread wheats; strong but non-elastic gluten in durum); and grain colour (red, white or amber).
We have the scientific classification of wheat as follows;
Kingdom: Plantae; Clade: Tracheophytes; Clade: Angiosperms; Clade: Monocots; Clade: Commelinids; Order: Poales; Family: Poaceae; Subfamily: Pooideae; Supertribe: Triticodae; Tribe: Triticeae: Genus: Triticum L.; Type species: Triticum durum[15] Species are T. aestivum, T. durum, etc.
The nutritional value of foods strongly depends on their nutritional and anti-nutritional composition. The anti-nutritional factors are principally associated with substances of natural and synthetic origin, which interfere with the absorption of nutrients, act to reduce nutrient intake, digestion, utilization and may produce other adverse effects. Anti-nutrients are frequently related to plant-based, raw or vegan diets and are naturally synthesized in plants [16]. Some common symptoms exhibited by some anti-nutrients in the body are nausea, bloating, headache, rashes, nutritional deficiencies, etc. [17]. Plants primarily use antinutrients for their own defense. Also, anti-nutrients can be evidently advantageous to humankind when consumed wisely.
Antinutrients are found in their highest concentrations in grains, legumes, beans and nuts, also in leaves, roots and fruits of certain varieties of plants. Anti-nutrients mostly found from plant sources are phytates, tannins, lectins, oxalates, saponins, etc. Oxalate prevents calcium from being absorbed in the body by binding with it [18]. Consumption of excessive tannins leads to enzymes responsible for protein absorption inactivated. Phytates consumption may lead to a lower mineral absorption and lectins are able to cause various reactions to the body [19]. Saponins have been linked to red blood cells damaging, enzyme inhibition and thyroid function intervention [20].
Fermentation is a desirable process of biochemical modification of primary food matrix brought about by microorganisms and their enzymes [21]. It is used in enhancing the bioaccessibility and bioavailability of nutrients from different crops [22]; improves organoleptic properties as well as extending the shelf life [23]. It makes food safe by inhibiting growth of pathogenic bacteria due to antimicrobial activity of lactic acid [24] and also detoxifies aflatoxin [23].
Germination is the process occurring at the beginning of the development of seeds into plants, during which they sprout [25]. It involves changes in the nutritional biochemical and sensory characteristics of the food. It is used in processing of cereal in improving the nutritional quality as it results in the reduction of anti-nutritional factors [26]. These changes are greatly associated with the activation of some endogenous enzymes making germinated food higher in nutritional quality compared to nongerminated seeds [27].
From classes used in North America for wheat grouping [28,29], Durum has been described as being very hard, transluscent, light-coloured grain used to make semolina flour for pasta and bulghur; high in protein, specifically, gluten protein. A strong and elastic gluten present in bread wheats enables dough to trap carbon dioxide during leaving, but elastic gluten interferes with the rolling of pasta into thin sheets. The gluten protein in durum wheats used for pasta is strong but not elastic. The yellowing colour of durum wheat and semolina flour made from it is due to a carotenoid pigment called lutein, which can be oxidixed to a coluorless form by enzymes present in the grain.
Some research work had been reported on Triticum durum. In the year 2000, Adeyeye et al. [30] reported on the calcium, zinc and phytate interrelationships in some foods of major consumptions in Nigeria (T. durum was involved). The chemical composition and the effect of salts on the food properties of T. durum whole meal flour had been reported [31]. Young and Greaves [32] reported on the influence of variety and treatment on phytin content of wheat. The amino acids and sugar composition of T. durum whole meal flour had been reported [33]. The relationship in the amino acid quality between raw, steeped and germinated wheat (Triticum durum) grains had also been reported [34]. As a follow up to reference number 34, the present research reports on the effects of fermentation and germination on raw, whole-wheat flour of Triticum durum in the evaluation of proximate, minerals and anti-nutrients composition.
Hypotheses
Correlational analysis of proximate composition, mineral composition, mineral molar ratios and antinutrients values of Triticum durum among pairs of raw/fermented samples (A/B), raw/germinated samples (A/C) and fermented/germinated samples (B/C) led to the generation of the following null hypotheses.
i. There is no significant difference in the correlational analysis of the proximate composition values of T. durum among pairs of A/B, A/C and B/C.
ii. There is no significant difference in the correlational analysis of the mineral composition values of T. durum among pairs of A/B, A/C and B/C.
iii. There is no significant difference in the correlational analysis of the mineral molar ratios of T. durum among pairs of A/B, A/C and B/C.
iv. There is no significant difference in the correlational analysis of the anti-nutrients values of T. durum among pairs of A/B, A/C and B/C.
The level of significance was set at rxy = 0.01 at n-2 (df).
2.1. Collection of Samples
The wheat grains (T. durum) were collected from farms located in Zaria, Kaduna State, Nigeria. About 1.5kg of the grains was used for the experiments.
2.2. Sample treatment
First of all, the shaft was removed by threshing, sorting of grains was done to separate bad grains, stones and other non-wheat particles. The sample was divided into three equal parts for use as raw, fermented (steeped) and germinated sample and labeled accordingly.
The portion labeled as raw (0.5kg) was not specially treated but was only dried to constant weight (8.87g/100g moisture content). The portion labaled for steeping (0.5kg) was placed into a plastic container, distilled water was added to cover the grains and left in the laboratory at ambient temperature (30.9°C) at 0.41Im2/ft light intensity for four days. After this, the grains were washed with distilled water, dried in the sun to constant weight (9.56g/100g moisture content) and stored in a covered plastic container. The portion labeled for germination (0.5kg) was treated as follows: grains were soaked in distilled water at room temperature for 24h; the grains were then spread on a damp fabric, protected from the direct sun for approximately 48h, until 5.04cm sprouts developed; germinated grains were dried in the sun for three days until constant weight of 8.94g/100g moisture content; the sprouts were manually removed and the desprouted grains were stored in a plastic container [35]. [The flow chart detailing the processes in the preparation of steeped and germinated samples had been depicted in Fig. 1.] [36]. Each sample was then homogenized, sieved using 200mm mesh size and kept in plastic bottles in the refrigerator (2.8°C), pending analysis.
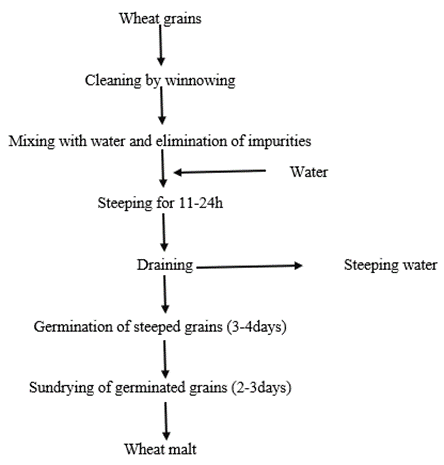
Figure 1: General flow diagram of traditional malting of wheat grains.
2.3. Sample Analysis
2.3.1. Proximate Analyses
Moisture content was determined gravimetrically using ventilated oven set at 105°C to dry the samples to constant weight [37]. Crude protein was determined by multiplying the estimated nitrogen content by a factor of 6.25 [38]. Extraction of crude fat (CF) was carried out by Soxhlet extraction apparatus with chloroform/methanol (2:1 v/v) mixture [39]. Total ash was determined by igniting the samples in a muffle furnace set at 550°C [40]. Crude fibre was determined by the method of AOAC [41] and carbohydrate was estimated by difference, i.e.
Carbohydrate (g/100g) = 100(Moisture + Crude protein + Crude fat + Fibre + Ash). Equation (1)
2.3.1.1. Total Energy
Total energy from protein, fat and carbohydrate in kJ/100g and kcal/100g was estimated using the Atwater Factors [42].
Total energy (kJ/100g) = (fat × 37) + (protein × 17) + (carbohydrate × 17) …………. Equation (2)
Total energy (kcal/100g) = (crude fat × 9) + (crude protein × 4) + (carbohydrate × 4)..Equation (3)
Utilizable energy due to protein (UEDP%) = % protein energy in total energy × 60% ..Equation (4)
Energy requirement for infants per day = 740kcal/(Total energy) × 100/1 ………………………. Equation (5)
Energy requirement for adult per day = 2500kcal/(Total energy ) × 100/1 ……………………….… Equation (6)
Energy requirement for adult per day = (3000 kcal )/(Total energy) × 100/1 ……………………….. Equation (7)
2.3.1.1. Conversion of CF to Total Fatty Acid (TFA)
Crude fat × 0.72 = TFA [43] …………….…………………………………………………………………..Equation (8)
2.3.1.2. Water Requirement for Complete Metabolism from Proximate Composition
Protein energy = P (kcal/100g)
Water for excretion = (Q) = (3P)a
Water deficit = (350/100 × P) = Tml
Water balance = (T-Q)ml …………………………………………………………………………………….Equation (9)
a = 1 Calorie of protein requires 3ml of water for by-products excretion [44].
2.3.2. Mineral Analyses
The minerals were analysed from the solution obtained by first dry ashing the samples at 550°C. The filtered solutions were used to determine: Na, K, Ca, Mg, Zn, Fe, Cu, Mn, Co by means of atomic absorption spectrophotometer (Buck Scientific Model- 200 A/210, Norwalk, Connecticut 06855) and phosphorus was determined colorimetrically by spectronic 20 (Gallenkamp, UK) using the phosphovanado molybdate [45]. All chemicals used were of analytical grade from British Drug House (BDH, London, UK). The detection limits for the metals in aqueous solution had been previously determined using the methods of Varian Techtron [46], giving the following values in µg/ml: Fe(0.01), Cu (0.002). Na (0.002), K(0.005), Ca (0.04), Mg (0.002), Zn (0.005), Mn (0.01) and Co (0.005). The optimal analytical range was 0.1-0.5 absorbance units with coefficients of variation from 0.9% to 2.21%.
2.3.2.1. Mineral Ratios
Ratios of Ca/P, Na/K, Ca/Mg, [K/(Ca + Mg)], Ca/K and Na/Mg were all calculated [47,48,49].
2.3.2.2. Mineral Safety Index (MSI)
The mineral safety index (MSI) [47] of Na, Ca, Mg, Zn, Fe and P were calculated using the formula:
Calculated MSI = MSI/ RAI × Research data result ……………………………………………Equation 10
where MSI = mineral safety index Table (standard) value.
RAI = recommended adult intake.
2.3.2.3. Mineral Molar Ratios
The [phytate]: [Zn], [Ca]: [Phytate],[Fe]: [Phytate] and [Ca] [Phytate]: [Zn] mole ratios were calculated as previously described by IZ: NCG[50] and Wyatt and Triana – Tejas [51]. Their equations:
[Phytate]: [Zn] = (Phytate (mg/100g)/660)/(Zn (mg/100g)/65.38) …………………………………………………………… Equation (11)
[Ca]: [Phytate] = (Calcium(mg/100g)/40.08)/(Phytate (mg/100g)/660) ………………………………………………………Equation (12)
[Fe]: [Phytate] = (Iron (mg/100g)/55.85)/(Phytate (mg/100g)/660) …………………………………………………………...Equation (13)
[Ca] [Phytate]: [Zn] = ([Calcium (mg/100g) /40.08]×[Phytate (mg/100g)/660])/(Zinc (mg/100g)/65.38)…………Equation (14)
2.3.2.4 Other Calculations on Mineral Data
i. Mineral percentages of each mineral in each sample.
ii. In the mineral safety index (MSI), differences (and their percentages) were calculated between standard MSI and calculated MSI.
2.3.3. Determination of Antinutrients Composition
Phytate was quantified using the method described by Harland and Oberleas [52]. The amount of phytate in the sample was calculated as hexaphosphate equivalent using the formula:
Phytate, mg/g sample = “mean K” x A x 20 / (0.282x1000) ………………………………………………………………………Equation (15)
Where: A = absorbance; "mean K" - std P (µg) /A/n(stds); phytate = 28.2 % P.
The phytate values were reported in mg / 100g. The determination of oxalate was described by Day and Underwood [53].Tannin determination followed the method of Makkar and Goodchild [54]. The quantitative determination of saponins followed the descriptions of Ukpabi Chibueze et al. [55]. Determination of flavonoid content was conducted using the method presented by Jia et al. [56]. Determination of alkaloids followed the procedure of Shamsa et al. [57].
2.3.3.1. Calculations on Antinutrients Data
i. Antinutrient percentages of each antinutrient in each sample.
ii. Differences between the antiutrient values (and the percentage differences) between the raw and processed samples.
2.4. Statistical Analyses
The statistical analyses are in two forms: descriptive and inferential statistics. For descriptive model, the data obtained were subjected to calculation of mean, standard deviation (SD) and coefficient of variation percent (CV%). For the inferential statistics, the model involved was the correlation analysis. The correlation model was subjected to statistical Table setting the critical level at rxy = 0.01 to find out if statistical differences existed within the samples as the case may be [58]. The degree of freedom was n-2 where n = number of items involved in the correlational analyses. The coefficient of correlation (rxy) was further expanded to variance (coefficient of determination) (rxy2), regression coefficient (Rxy). Further on this, was the calculation for coefficient of alienation (CA) and idex of forecasting efficiency (IFE) [59]. The statistics were between the pairs of raw/fermented (A/B), raw/germinated (A/C) and fermented/germinated (B/C) samples in: proximate composition; mineral composition; mineral molar ratios and antinutrients constituents.
2.5. Pubchem Database
Pubchem is a database of chemical molecules and their activities against biological assays. The system is maintained by the National Centre for Biotechnology Information (NCBI), a component of the National Library of Medicine, which is part of the United States National Institute of Health (NIH). Hence we can talk of Pubchem Compound ID (CID) [60].
2.5.1. PubChem CID for Mineral Elements
Mineral elements studied in this report were: Copper/Cu (PubChem CID: 23978); Iron/Fe (PubChem CID: 23925); Zinc/Zn (PubChem CID: 23994); Magnesium/Mg (PubChem CID: 5462224); Calcium/Ca (PubChem CID: 5460341); Cobalt/Co (PubChem CID: 104730); Manganese/Mn (PubChem CID: 23930); Sodium/Na (PubChem CID: 5360545); Potassium/K (PubChem CID: 5462222); Phosphorus/P (PubChem CID 6326970).
2.5.2. PubChem CID for Some Antinutrients
Some antinutrients studied in this report were:
Tannic acid/Tannin [C76H52O46- PubChem, CID: 16129778]; Saponin [C58H94O27- PubChem, CID198016]; Oxalate [C204-2 – PubChem, CID: 71081], parent compound: CID 971 (oxalic acid).
3.1. Proximate Composition
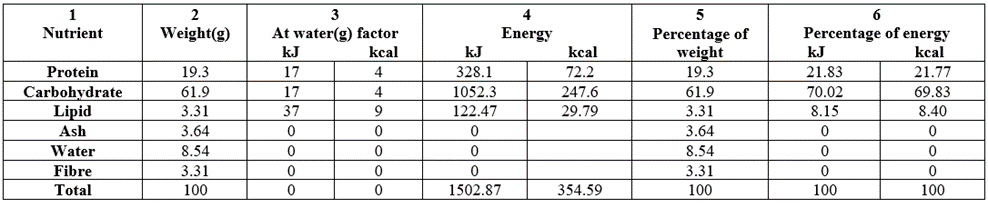
Table 2 contained the macronutrient/energy and percentage composition of raw (untreated or control) Triticum durum whole grain grown in Nigeria. Column 2 contained the weight (g/100g) distribution of the nutrient contents (proximate) of the raw sample. Protein (19.3g/100g) was high as well as carbohydrate (61.9g/100g). Moisture was slightly high at 8.54g/100g whereas total lipid, total ash and crude fibre were all within the bracket of 3.31=3.31 [lipid=fibre] to 3.64 (ash) g/100g. The total proximate energy values had 1502.87kJ/100g (354.59kcal/100g).
Table 2: Macronutrient/energy content and percentage composition of raw (untreated) Triticum durum whole grain grown in Nigeria.
The proximate values in fermented T. durum were depicted in Table 3. These values were reduced in Table 3 compared to values in Table 2: (Table 3/ Table 2, g/100g): protein, 19.2/19.3; ash, 2.70/3.64; fibre, 2.99/3.31/ whereas these values were better in Table 3 than Table 2 (although very slightly): carbohydrate, 62.2/61.9; Lipid, 3.39/3.31; moisture, 9.55/8.54; making a sharing of 3:3 (Table 2: Table 3 or vice-versa). The total energy in Table 3 was marginally higher than Table 2: 1509.23/1502.87kJ/100g (356.11/354.59kcal/100g).
Table 3: Macronutrient/energy content and percentage composition of fermented Triticum durum whole grain grown in Nigeria.
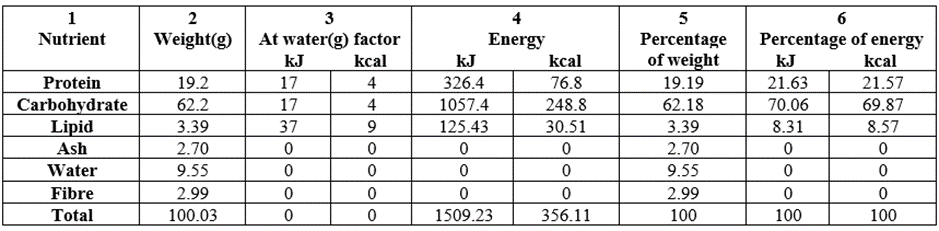
Table 4 contained the macronutrient constituents of the proximate composition of germinated T. durum. Comparisons of the results from Table 2/3/4 (g/100g) can be seen as follows: protein 19.3/19.2/21.0; carbohydrate, 61.9/62.2/60.1; lipid 3.31/3.39/3.49; ash, 3.64/2.70/3.55; water, 8.54/9.55/8.94; fibre, 3.31/2.99/2.93; and energy, 1502.87/1509.23/1507.83kJ/100g (354.59/356.11/355.81kcal/100g). Consistently enhanced parameter was lipid and consistently reduced parameter was fibre across the board. Both parameter reduction and enhancement were due to the treatment of the raw sample along the treatment lines.
Table 4: Macronutrient/energy content and percentage composition of germinated Triticum durum whole grain grown in Nigeria.
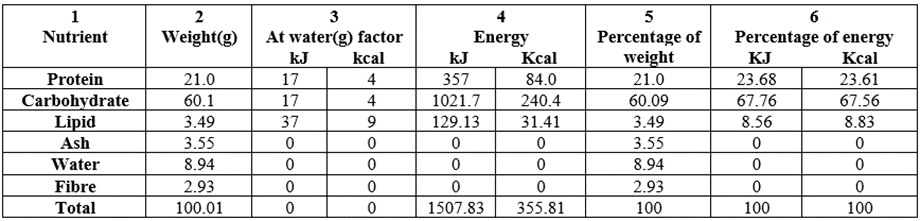
Table 5 exhibited the concentration differences and the percentage differences in the proximate composition between raw and fermented (A-B), between raw and germinated (A-C) and between fermented and germinated (B-C) samples.
In A-B, the followings were positive: protein, and ash; in A-C, ash and fibre were positive and in B-C, moisture, fibre and carbohydrate were positive but total was zero. Positive meant that ash and protein were A>B; in column 3, A>C in fibre and carbohydrate whereas in column 4, B>C in moisture, fibre, and carbohydrate but B=C in total. On the whole, B>A (in 5⁄7 or 71.4% parameters); C>A (in 4⁄7 or 57.1% parameters); and C>B (in 3⁄6 or 50.0% parameters since in total, C B).
From literature, it has been shown that 100g wheat provides 1,368 kilojoules (327 kilocalories) of food energy and hence, a rich source (20% or more of Daily Vaule, DV) of multiple essential nutrients, such as protein, dietary fibre, etc. Wheat is 13% water, 71 percentage carbohydrates, 1.5 percentage fat. Its’ 13% protein content is mostly gluten (75-80% of the protein in wheat) [13]. These values are highly comparable to the present results.
Table 5: Concentration differences (proximate) in the Triticum durum between raw and fermented (A-B), between raw and germinated (A-C) and between fermented and germinated (B-C) samples grown in Nigeria.

In column 2, negative means A less than B, in column 3, negative means A less than C; in column 4, negative means B less than C.
The lipid analysis of the samples had been depicted in Table 6. The crude fat (CF) was converted to the corresponding total fatty acid (T-FA) by a factor. Values of the CF ranged from 3.31-3.49g/100g and corresponding T-FA as 2.38-2.51g/100g with the trend in both parameters being raw (A) less than fermented (B) less than germinated (C). Values of other lipids (like sterols, phospholipids, etc.) would then be (g/100g): 0.93(A), 0.95(B) and 0.98(C) following the earlier trend. The (T-FA/Lipid) % was A C 71.9 and B was 72.0 and for other lipids, A C = 28.1% and B= 28.0%. Total energy contribution from lipid ranged as 122.47-129.13kJ/100g (29.79-31.41kcal/100g) and the T-FA range was 88.06-92.87kJ/100g (21.42-22.59kcal/100g) whereas for other lipids, we have 34.41-36.26kJ/100g (8.37-8.82kcal/100g) and all followed the earlier trend. All the parameter variations (CV%) were all very low ranging from 0.058-2.67 showing the homogenicity of the results of the parameters.
Table 6: Lipid analysis of the lipid values of the T. durum samples grown in Nigeria.
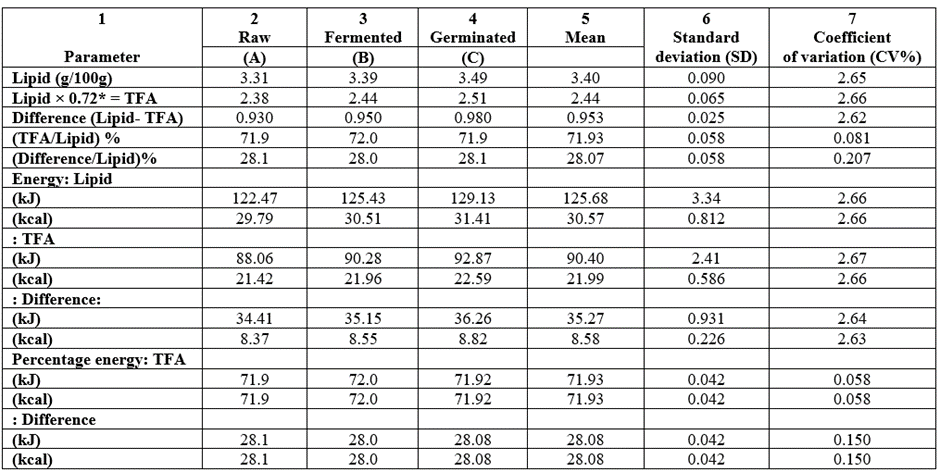
* = Conversion factor.
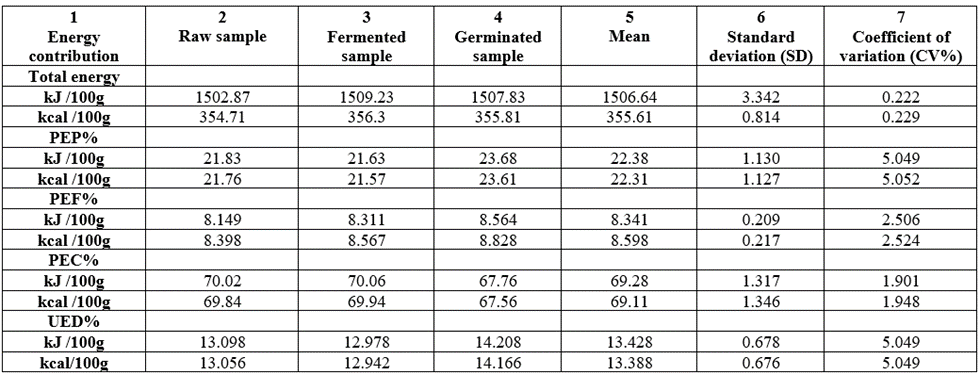
The proportion of total energy due to protein (PEC%) and utilizable energy due to protein at 60% (UEDP%) utilization from the proximate values were shown in Table 7. The total energy value of the samples: 1502.87-1509.23kJ/100g [1.50-1.51MJ/100g] or 354.71-356,3kcal/100g showed the samples to be energy dense. The PEP% range was 21.6-23.7. For PEF%, values range was 8.40-8.83 and in PEC% we have 67.8-70.1. This meant that PEF% less than PEP% less than PEC percentage. Human control groups should consume diets that are similar to the average diet of population (e.g. 10-15% of energy as protein, 30-35% of energy as fat and 45-55% of energy as carbohydrate). The T. durum energy values had their energy percentages lower or higher than the stated values but this is highly comparable. However, in the case of PEF%, it is much lower than the following comparisons: the PEF% values in this study were lower than recommended 30% of the total energy requirement [61] and 35% for total energy intake [62]. The present total energy report of 1.50-1.51MJ/100g fell within the value of 1.3-1.6MJ/100g from cereal [63]. The utilizable energy due to protein (UEDP%) for the samples (assuming 60% utilization) ranged from 13.1-14.2. An adult man who requires about 55g protein per day with 60% utilization will be satisfied highly by the UEDP% since the requirement for the group is just 8%. The UEDP% values showed that the samples have protein concentration in terms of energy that would be more than enough to prevent energy malnutrition in children and adults fed solely on the samples as a main source of protein. The PEF% low values is useful for people wishing to adopt the guidelines for a healthy diet. All the CV% values were low showing that any of the samples might be able to carry out the food properties of another sample and vice versa.
Table 7: Proportion of total energy due to protein (PEP%), fat (PEF%), carbohydrate (PEC%) and utilizable energy due to protein at 60% (UED%) from the proximate values of wheat grown in Nigeria.
The approximate sample weight equivalent to the energy requirement of infants and adults from the proximate composition can be seen in Table 8. The daily energy requirement for an infant is 740kcal and range from 2500-3000kcal for adults depending on adults physiological state [64]. This shows that for 2500kcal model, an adult would need to consume between 701.66-704.80g and between 841.99-845.76g (for 3000kcal model) depending on the sample to cater for energy need per day. Infants would have to take between 207.69-208.62g (depending on the sample) in order to satisfy their energy needs per day. The present values for sample weight equivalent were lower than the literature reports: Acanthurus monroviae adult: 733g and 880g (for 2500kcal model and 3000kcl and model respectively), infant: 220; Lutjanus goreensis: adult : 735g and 882g respectively, infant: 221 [65]; even in the body parts of stock fish (Gardus morhua), their weight equivalent levels were higher than the present report as shown, body part/energy (kcal)/2500kcal equivalent (g)/3000kcal equivalent (g)/740kcal equivalent(g) : muscle/352/710/852/210; body/348/718/862/213; gill/349/716/860/212; bone/346/723/867/214; head/346/723/867/214; skin/362/691/829/204; eyes/352/710/ 852/210 [66].
Table 8: Approximate sample weight equivalent to the energy requirement of infants and adults from the T. durum proximate composition grown in Nigeria.

The water required for excretion of urea and sulphate formed as well as water deficit as a result of metabolism in each sample is depicted in Table 9. The values of water required for complete metabolism of 100 calories of food substances are: preformed water: 0.0g (for protein, fat and starch); water gained by oxidation: 10.3 (protein), 11.9 (fat) and 13.9 (starch); water lost in excreting end products: 30 (protein) and 0.00 (for both fat and starch); water deficit: 350 (protein), 48 (fat) and 46 (starch). 1 Calorie of protein requires 3ml of water for excretion of urea and sulphate formed from it [44]. In Table 9, the required water for excretion of urea and sulphate by-products formed (Q) ranged from 230.4-882ml. Hence, the required water balance for complete metabolism for each sample (T-Q)ml: raw (579), fermented (576), and germinated (630) all with low CV% values. Effect of the water deficit cannot be mitigated by carbohydrate and fat since they still have their own water deficit (although insignificant). However, water deficit in the samples could be mitigated by water intake.
Table 9: Water requirement for complete metabolism of the proximate composition (protein part) o the T. durum samples grown in Nigeria.
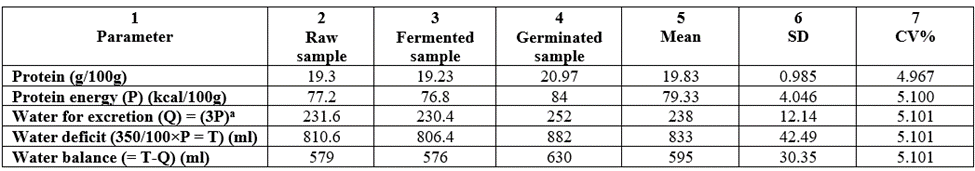
a = 1 calorie of protein requires 3ml of water for by-products excretion.
The correlational analysis of the proximate composition values among pairs of raw/fermented (A/B), raw/germinated (A/C) and fermented/germinated (B/C) samples had been depicted in Table 10. The descriptive analysis involved were mean, standard deviation (SD) and coefficient of variation (CV%). In the inferential statistics, model used was correlation coefficient (rxy) determination, variance (rxy2), regression coefficient (Rxy) and the rxy was evaluated at rxy =0.01 confidence level to see if significant differences occurred between the pairs compared setting the degree of freedom (df) at n-2. Further, the rxy value was further subjected to the evalution of coefficient of alienation (CA) and index of forecasting efficiency (IFE). Results in Table 10 showed that all the rxy values were positive, high and significantly different since calculated values (0.9943-0.9990) > rT of 0.917 at n-2 [6-2 = 4 (df)]. All the rxy2 were also high. The Rxy values showed that sample A (column 2), sample A (column 3) and sample B (column 4) were each greater than 1.00g. Rxy could further be explained thus: Rx:Ry = Rx( 1.00): Ry (0.9812) in samples pair A/B; hence Rxy = x(1.00): y(0.9812) in samples pair A/B; hence Rxy = x (1.00) : y(0.9812); this explanation goes for Rxy in A/C and B/C. First members of the pairs in columns 2,3,4 had mean values of 15.8g, 15.8g and 16.7g respectively and respective values of SD/CV%: 23.5/149,23.5/149,23.2/139 showing that the mean values were low with correspondingly high vales of SD/CV%. However, the mean, SD and CV% were close among each member of the group. In the second member of the pairs in columns 2,3,4 (B,C,C respectively), the mean values were uniform at 16.7g for B,C,C respectively whereas the respective SD/CV% values were 23.2/139, 22.4/134, 22.4/134 showing similar characteristics as earlier discussed for the columns first pair member above. The CA values were low at 0.04360-0.1063; the IFE values were correspondingly high at 0.8937-0.9564. The CA and IFE work together, when CA is high, IFE is low and when IFE is high, CA is low since CA + IFE = 1.00 (fractional basis) or CA + IFE = 100% (when valued on percentage basis). CA represents index of alienation or non-relationship or error in the prediction of relationship between comparable pair; hence, high CA mean non-relationship or high error of prediction. On the other hand IFE represents reduction in the error of prediction of relationship. In all the CA and IFE values, CA very less than IFE as we have CA (4.36-10.63%) very less than IFE (89.37-95.64%). Since CA was low and IFE was high, it followed that any member of a pair can carry out all the food functionalities of the other and vice versa.
Table 10: Correlational analysis of the proximate composition values of Triticum durum among pairs of raw/fermented samples (A/B), raw/germinated samples (A/C) and fermented/germinated samples (B/C) grown in Nigeria.

Mean1, SD1, CV%1 represent values due to A (column 2), A (column 3), B (column 4); Mean2, SD2, CV%2 represent values due to B (column 2), C (column 3), C (column 4); * Values significantly different at r=0.01 at n-2=6-2=4(df) at critical level of 0.917.
3.2. Mineral Composition
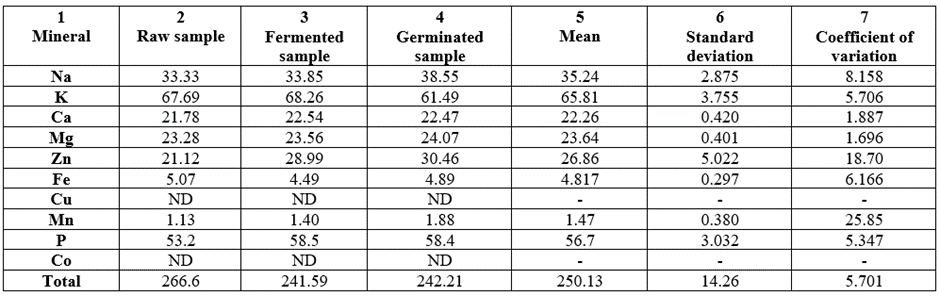
The mineral composition (mg/100g) of the samples are depicted in Table 11. Cu and Co were not detected in any of the samples. Minerals of relatively low values were Fe(4.49-5.07, CV% of 6.166) and Mn(1.13-1.88, CV% of 25.85, being the highest CV%). Minerals of average levels were Ca(21.78-22.54, CV%= 1.887), Mg(23.28-24.07, CV% = 1.696), and Zn(21.12-30.46, CV% = 18.70, being the second highest CV%). The highest concentrated three minerals were P(53.2-58.5, CV% = 5.347), Na(33.33-38.55, CV% = 8.158), and K(61.49-68.26, CV% = 5.706). The ratio of K:Na in the samples were, raw (2.03:1.00); fermented (2.02-1.00); and germinated (1.60:1.00). On the whole, the concentration trend at mg/100g was: Raw (266.6) > Germinated (242.21) > Fermented (241.59).
All plant ash is similar in certain respects. The main constituent is usually potassium, which often comprises nearly 50% of the total weight of ash. Animal tissues, in general, are much less rich in K, but on the other hand, they usually contain more sodium; this is possibly related to the preferential accumulation of K in large vacuoles which are a prominent feature of many plant cells, but meristematic cells, which only have small vacuoles, show an even greater preference for potassium over Na [67]. After K, Ca is often the most abundant element in plant ash, although its concentration ranges widely from trace amounts in maize (Zea mays) grains to over 7% of the dry weight in mature sunflower (Helianthus annuus) leaves. Plant ash is also rich in Mg, which is a constituent of some organic molecules, including chlorophyll and also occurs as free ions in the cell sap. Phosphorus is present in plant ash mainly as phosphorus pentoxide phroduced by oxidation of organic and inorganic phosphate during burning. The ash from plant seeds is particularly rich in phosphorus, most of which is derived from phytin (calcium and magnesium myo-inositol hexaphosphate) [68].
Table 11: Mineral composition values (mg/100g) of raw, fermented and germinated samples of Triticum durum grown in Nigeria.
ND = Not detected; -= Not determined.
Range of concentration (ppm of dry matter) of various elements in plant ash goes thus K-Ca-Na-Mg-P-Fe-Mn-Zn-Sr-etc. [69]. In the present report, percentage levels trend in the samples mineral goes thus: K>P>Na>Zn>Mg>Ca>Fe>Mn. However, this trend changed within the samples due to processing. The CV% values were generally low at 0.00-23.23 showing the variation among the percentage levels to be low. The percentage levels of the minerals were shown in Table 12.
Table 12: Percentage levels of the mineral composition values of Triticum durum samples produced in Nigeria.

- = Not determined.
The mineral concentration differences (and their percentage differences were shown in Table 13. In column 2, we have raw-fermented (A-B) samples; among the minerals with discernible levels, 8/9 (88.9%) parameters were higher in B than in A; exception being 1/9 (11.1%) in Fe. Percentage differences ranged from 0.842 (K) – 37.3 (Zn); meaning Na, K, Ca, Mg, Zn, Mn, P and total minerals were enhanced by fermentation. In fermented-germinated samples, B was more concentrated than C in 5⁄9(55.6%) parameters whereas C>B in 4⁄9(44.4%) parameters. For raw-germinated (A-C) samples, C>A in 7⁄9(77.8%) parameters and C
Table 13: Mineral concentration differences in the Triticum durum between raw and fermented (A-B), between raw and germinated (A-C) and between fermented and geminated (B-C) samples grown in Nigeria.
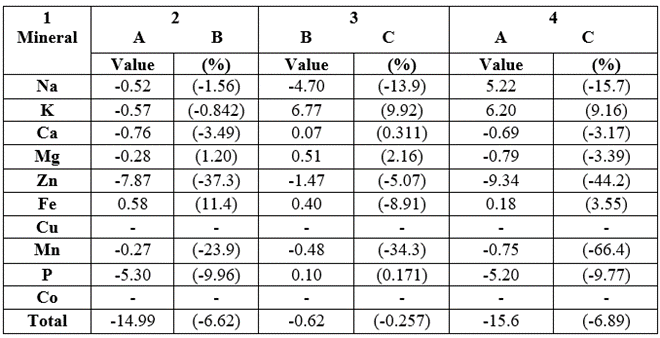
In column 2, negative means A less than B; in column 3, negative means B less than C; in column 4, negative means A less than C.
The mineral ratios of the samples were shown in Table 14. The Ca/P values were all lower than 0.5 which is the minimum ratio required for favorable Ca absorption in the intestine for bone formation [70]. Ca/P result values ranged from 0.385-0.409, this is within the poor class, hence one needs to be careful unless food is good for other reasons. None of the Ca/P ratios fell within the acceptable ideal range. The Ca/P ratio is reported to have some effect on Ca in the blood of many animals [71]. For the Na/K ratios all fell below both reference balance ideal and acceptable ideal range; also, none of the ratio was up to 0.60 (except germinated sample, 0.627) which is the ratio that favours none enhancement of high blood pressure disease in man [70]. To raise these ratios may not be necessary since it is always good to have high level of K than Na in any food substance. Ca/Mg ratios were each below the reference ideal and acceptable ideal range. The Ca/Mg values ranged from 0.934-0.957 which is close to 1.00. The milliequivalent ratios of [K/(Ca+Mg)] were all greater than 2.2 as values ranged from 2.64-3.00; to avoid the promotion of hypomagnesaemia in human beings [72], more K would have to be taken with wheat. All the Ca/K ratios fell below the range of 2.2-6.2 and reference balance of 4.20. The Na/Mg ratio has the following information: ideally there should be 4:1 ratio of Na relative to Mg with a range of 2-6 being acceptable. The sample results gave ratios of 1.43-1.60 which were all below the acceptable range of 2-6. Mineral ratios analyses have been very important in analysis of hair as a biochemical marker. Most of the ratios calculated here were for the purpose of gathering analytical data.
The mineral ratios are often more important than the individual mineral levels themselves and this had been illustrated by the following statements by Vitale et al., as quoted by Watts [48]: “Determining nutritional interrelationships is much more important than knowing minerals level alone. From a global standpoint, although dietary deficiency is at the more serious end of the spectrum, the opposite end, dietary excess and aberrations contribute to the burden of disease”. “Mild and sub-chemical deficiencies of nutrients outnumber overt syndromes ten to one”. The calculated mineral ratios revealed not only the important balance between these elements, but that also provide information regarding the many possible factors that may be represented by a distruption of their relationship such as disease states, physiological and developmental factors, the effects of diet, drugs, would also predispose a person with parasymphatetic dominance to certain health conditions of severe or chronic [73].
Table 14: Mineral ratios of Triticum durum samples from Nigeria.

*Not determined ratios were Zn/Cu, Fe/Cu and K/Co because both Cu and Co recorded ND.
The mineral safety index (MSI) values of Na, Ca, Mg, Zn and P of the samples are shown in Table 15. The RAI (recommended adult intake), the standard MSI were included in the Table 15. Also, the calculated MSI (CV) values, the difference (D) between MSI(T) and MSI(C) and the percentage difference (%D) were all calculated for the minerals involved in the various samples. Differences (and percentage differences) between MSI(T) - MSI(C) were positive in all the samples for Na, Ca, Mg, Fe and P whereas Zn was negative. For Na, the %D trend was 93.3 (raw) (column 4), 93.2 (fermented) (column 5) and 92.3 (germinated) (column 6). For Ca, %D range was 98.1-98.2; Mg %D range was 94.0-94.2; Fe varied much differently, %D was 66.2-70.1 and P, %D range was 95.1-95.6. This meant that Na, Ca, Mg, Fe and P cannot be deleterious to the samples consumers since MSI(T) > MSI(c) for those minerals. On the other hand, Zn was higher than the standard MSI in all the samples, hence the D of MSI(T) and MSI(c) would result into negative values. Hence %D values in Zn were -40.8 (raw, column 4); -93.3 (fermented, column 5); and -103 (germinated, column 6). The meaning of this is that raw Zn would be deleterious to its consumers to the level of 40.8%, fermented Zn would be deleterious to the level of 93.3% whereas germinated Zn would be deleterious to the level of 103%. However, highly deficient consumers of Zn deficient diets would have good Zn supplements by consuming the wheat samples in particular the processed samples. Earlier, negative D had been reported for MSI in Fe and Zn in four fast foods consumed in Nigeria [71].
Table 15: Mineral safety index (MSI) of Na, Ca, Mg, Zn and P of T. durum (raw, fermented and germinated) samples from Nigeria.
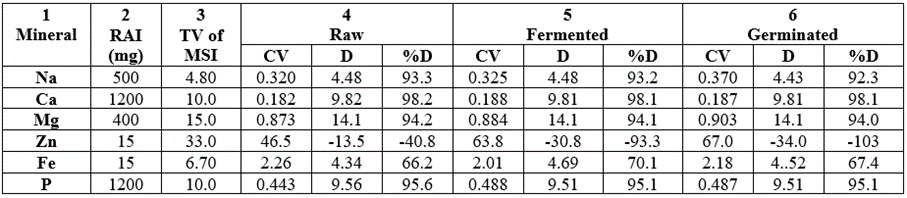
CV = Calculted MSI; TV = Table MSI; D = Difference; RAI = Recommended Adult Intake; No MSI for K, Mn and Cu; Cu only being due to ND.
The Table 16 contained the statistical analysis result of the mineral composition data depicted in Table 11. The rxy values of samples A/B, A/C and B/C were high, positive and significantly different at rxy =0.01 and n-2= 8-2 =6 (df) at 0.834. The rxy2 values were high. The Rxy values were 1.00:1.03(A/B); 1.00:0.9580 (A/C); and 1.00:0.9295 (B/C); the Rxy value in A/B showed that B>A. All the mean values were moderately high (23.3-30.3mg/100g); both the SD and CV% values were high as shown: range of SD was 22.0-23.5 and CV% range was 72.6—80.2. All the CA values were lower than all the IFE values: CA(0.1233-0.2049) very less than IFE IFE (0.7951-0.8767) making prediction of relationship between paired samples simple and reliable and carry all the positive attributes of low CA values.
Table 16: Statistical analysis result of the mineral composition data depicted in Table 11.

*Values were significantly different at r=0.01, at n-2= 8-2= 6 (df) and critical level of 0.834.
3.2.1. Mineral Molar Ratios
Table 17 showed the mineral molar ratios of the samples. In a general term, bioavalability is a term that refer to how well a nutrient can be absorbed and used by the body. Bioavalability can be affected by many factors like the presence of antinutrients such as phytates, oxalates, tannins and polyphenols in foods, a person’s need, fibre, competition with other nutrients and acidity of intestinal environment [74]. Minerals normally classified as micronutrients are needed by our body in small amounts. Deficiency in minerals, however, can have a major impact on health such as anaemia and osteoporosis that commonly occur in both developed and developing countries. The study under discussion focuses only on Fe, Zn and Ca. Literature shows that in Malaysia, the incidence of anaemia due to deficiency of Fe is nearly one million cases (969, 645), osteoporosis due to Ca deficiency is 2,421,432 cases [75]. The cause of mineral deficiency is commonly due to its low bioavailability in the diet. One of the factors is the presence of phytate. Phytate, which is also known as inositol hexakisphosphate, is a phosphorus containing compound that binds with mineral and inhibits mineral absorption. The presence of phytate in foods has been associated with reduced mineral absorption due to the structure of phytate which has high density of negatively phosphate groups which form very stable complexes with mineral ions causing non-availability for intestinal absorption [76]. Phytates are generally found in food high in fibre especially in wheat bran, whole grains and legumes [77].
Many techniques have been used to determine the bioavailability of minerals in the human body. One of the methods is by measuring the molar ratio of phytate/minerals in the food and diet [78]. The proportion of samples with ratios above suggested critical values has been calculated; phytate: calcium > 0.24[79], phytate: iron > 1.00 [80], phytate: zinc > 15 [81,82,78], calcium: zinc > [83,84]. The Phy: Zn, Ca: Phy, Ca:Zn, Fe: Phy and [Ca] [Phy]: [Zn] levels of the samples were depicted in Table17. A high incidence of suboptimal Zn status may exist among rural populations of low-income countries consuming cereal-based diets, low in animal products [85]. Indeed, the first cases of severe Zn deficiency in humans were reported among rural populations in Egypt and Iran [86,97, 88]. The high phytic acid level of cereal in these diets was probably a significant etiological factor in the development of Zinc deficiency [89]. Oberleas and Hardland [90] showed that foods with a molar ratio of Phy: Zn > 10 showed adequate bioavailability of Zn but problems were encountered when the value was > 15. The Phy: Zn molar ratio has been variously reported as an index of Zn bioavailability [91] and its range of 5-15 had been described by WHO [92] as being equivalent to moderate Zn bioavailability. All the Phy: Zn values were < 5> 6:1; here phytate is completely precipitated from the solution. Thus, both the solubility of phytate and availability of Zn in the intestine are dependent on Ca level [95]. All the presently reported Ca: Phy had values > 6:1, it meant that the Zn would be bioavailable. Ferguson et al [96] showed that the molar ratio varies with different foods and recommended that this value be used in conjunction with other data to explain the availability of Zn using the Ca: Phy ratio. The present results for [Ca] [Phy]/[Zn] that is [Ca × Phy : Zn] were also shown in Table 17. Ellis et al [97] and Davies and Warrington [98] indicated that the ratio of Ca × Phy : Zn is a better predictor of Zn bioavailability and said that if the value were greater than 0.50mol/kg, there would be interference with the availability of Zn. The Cax Phy: Zn values in the samples were each lower than the critical value of 0.50mol/kg (being 0.00024-0.00051) thereby making the Zn very bioavailable from the samples. Ca:Zn values were all < critical> 1.00.
Table 17: Phy: Zn, Ca: Phy, Fe: Phy and [Ca] [Phy]/[Zn] molar ratios of the raw, fermented and germinated samples of Triticum durum from Nigeria.

amg of Ca/AW (atomic weight) of Ca:mg of Phy/AW of Phy; bmg of Phy/AW of Phy:mg of Zn/AW of Zn; cmg of Fe/AW of Fe: mg of Phy/AW of Phy; d(mol/kgCa) (mol/kg Phy)/(mol/kg Zn).
The statistical analysis result of the data on mineral ratios was depicted in Table 18. The rxy values for all sample pairs were positive, high and significantly different. Corresponding rxy2 values were also high. Mean values were low: 5.757-6.056; SD values were higher than the mean values: 8.475-10.76. CV% values were all high: 168.9-179.1. CA values were less than IFE values. CA (0.0173-0.0346) less than IFE IFE (0.9694-0.9827), hence prediction of relationship among sample pair groups would be easy, simple and reliable.
Table 18: Statistical analysis result of the data on mineral molar ratios depicted in Table 16.
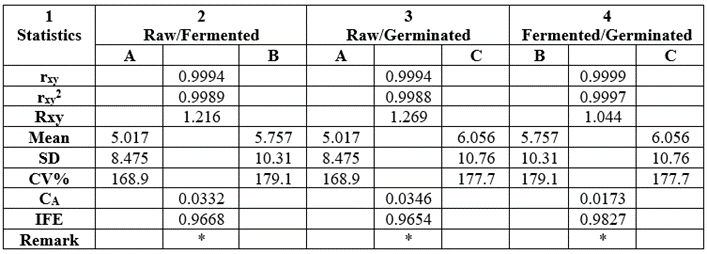
*Values were significantly different at r=0.01 at n-2=5-2=3(df) and critical level of 0.959.
3.3. Antinutrient Constituents
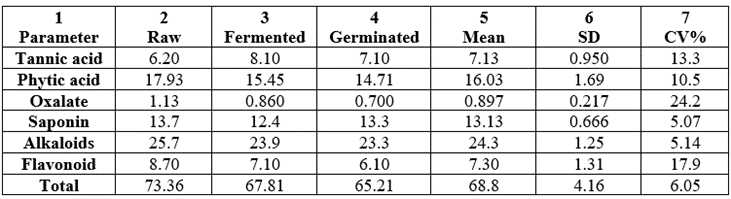
Table 19 contained the antinutrient constituents. They were tannic acid, phytic acid, oxalate, saponin, alkaloids and flavonoid. The total antinutrient constituents ranged between 65.21 and 73.36mg/100g. It should be noted that there was consistent reduction from raw to germinated samples as follows (mg/100g) 73.36 (raw) > 67.81 (fermented) > 65.21 (germinated) with grand mean value of 68.8 ± 4.16mg/100g and CV% of 6.05. The total value range exhibited the effect of processing on the samples.
3.3.1. Phytic Acid
Phytic acid levels in the samples were (mg/100g): 17.93 (raw) > 15.45 (fermented) > 14.71 (germinated). These values were relatively low. These values were also highly comparable to the literature values obtained in pearl millet grains [36]; follow the comparisons, wheat/millet (mg/100g): raw (17.93/15.7), fermented (15.45/18.1), germinated (14.71/10.7). Some studies had shown that the Asian diet contains very high amounts of phytate compared with western diets. For example, a study in India showed that phytate content in their foods ranged from 480 to 520 mg/100g [99]. The phytate content of Korean foods ranged between 191.7 to 973.3mg/100g[100], whilst a study in Indonesia showed that phytate content ranged between 8 to 319mg/100g for cereals and 24 to 108mg/100g for legumes [101]. Results of 13 species found in Nigeria had their phytate levels ranging between 390 to 6210mg/100g [102]. In the samples of Bambara groundnut, phytyic acid values (mg/100g) were 29.2 (testa), 17.5 (dehulled) and 14.4 (whole seed) [103], values being comparable to the present results. Also, seven varieties of Nigeria garden egg fruits had phytate levels of 507-2788mg/100g [104]. In Adeyeye et al [30], various food phytate values were reported: legumes (14-344mg/100g) and cereals (112-287mg/100g).
Values reported for Canavalia ensiformis ranged from 5.1-18.5mg/100g; 6.0-15.3mg/100g for Mucuna pruriens seed flours [105] and 33.4-37.8mg/100g for groundnut seed samples [106].
Phytates and phenolics are known antioxidants present in the bran layers of cereal grains. Phytic acid forms chelation complexes with various divalent minerals (e.g. Fe), suppressing the iron-mediated free-radical oxidant damage created by the colonic bacteria [107]. Phytates are also inhibitors (antinutrients) and they have been shown to have some beneficial effects also. Phytate has been reported to reduce the risk of colon and breast cancer in animals, lowers plasma glucose, insulin and / or improve blood lipid profile in humans [108]. Shamsuddin [109] has shown that only phytate in the form of inositol trisphosphate (IP3) can inhibit the absorption of minrals.
3.3.2. Tannic Acid
Tannins values were lower than the phytic acid values, tannic acid values ranged from 6.20-8.10mg/100g. Enhancement occurred in fermented than in the germinated samples; mean was 7.13±0.950 and CV% of 13.3. Tannic acid was one of the antinutrients that did not undergo reduction in the processed samples. Tannin values were also low in pearl millet with values of fermented = germinated = 0.68g/100g and raw = 0.50 [36] and was enhanced as in wheat samples during fermentation and germination processes. During fermentation, roasting and alkalization mono and oligomeric – catechins may be partially polymerized into tannins; could this have resulted into higher levels of tannin in both pearl millet and whole wheat on fermentation? Tannin is known to possess antioxidative properties in vitro as well as certain potential preventive effect against a number of chronic conditions including cancer and cardiovascular disease [110]. In natural cocoa cake, cocoa liquor and alkalized cocoa powder sourced in Nigeria, tannin contents ranged from 4.72-8.72g/100g [110]. Other literature values of tannin were: 0.09-0.84mg/100g in Bambara groundnut seed parts [103]; 0.35-0.85mg/100g reported for groundnut samples [106]; 0.3-0.9g/100g for C. ensiformis and 0.8-7.8g//100g for M. prupriens [105]. Tannins have been reported to bring about their antinutritional influences (especially in monogastric animals) largely by precipitating dietary proteins and digestive enzymes to form complexes which are not readily digestible [111].
3.3.3. Oxalate
Oxalate values in the samples ranged from 1.07-1.54mg/100g having a mean value of 1.29±0.236mg/100g and CV% of 18.3 (largest CV% in the antinutrients) with consistent reduction from raw fermentation germination. The present level of oxalate were lower to 2.88-4.86 in millet [36]; lower than 5.02-8.59mg/100g in Bambara [103]; 4.08-6.42mg/100g reported for groundnut seed flours [106]; 2.46-6.03mg/100g reported for natural cocoa cake, cocoa liquor and alkalized cocoa [36]. Oxalate presence has an unerirable effects on calcium absorption and utilization. Oxalate combines with Ca to form a compound known as calcium oxalate that passes through the intestine without being absorbed. Calcium oxalate is responsible for most of the kidney stone formation. About half of all the kidney stones are calcium phosphate, magnesium ammonium phosphate and calcium carbonate. The amount of oxalate formed normally depends on the amount of oxalic acid in the food [112]. Formation of these stones frequently reflects chronic alkalinity of bladder and renal pelvic urine caused by infection with bacteria that hydrolyze urea, releasing ammonia [113].
3.3.4. Saponin
Saponins are naturally occurring substances with various biological effects. Some saponins (steroid or triterpene glycoside compounds) can be used for food while others are toxic. Saponin parameter values ranged from 12.4-13.7mg/100g with trend of (mg/100g): 13.7(raw) > 13.3 (germinated) > 12.4 (fermented) showing reduction more in fermented than in germinated samples. The variation was however low at 5.07%. Saponins with a bitter taste are toxic in high concentrations and can affect nutrient absorption by inhibiting enzymes (metabolic and digestive) as well as by binding with nutrients such as zinc. In the presence of cholesterol, saponins exhibit strong hypocholesterolemic effect [114]. They can also lead to hypoglycemia [115] or impair the protein digestion, uptake of vitamins and minerals in the gut, as well as lead to the development of a leaky gut [116].
3.3.5. Alkaloids
Alkaloids constitute a class of diverse allelochemicals, some of which have great dietary importance that often goes unnoticed [111]. There have been reports that if ingested by ewes between (usually) days 8 and 17 of gestation teratogenic alkaloids can alter normal fetal development resulting in fetal malformation [117]. Forage alkaloids were implicated for the near epidemic increase in the birth of monstrous lambs with single mid-facial eyes in the Rocky Mountain region of the United States in the 1950’s [111]. Apart from forage alkaloids, the need to develop rapid technique to control the quality and evaluate the safety of alkaloid-containing foods has been stressed [118]. Examples of such food alkaloids are the steroidal glycoalkaloids present in potato and potato products, which include a-solanine and a-chaconine. Solanine and chaconine are hemolytically active and toxic to fungi and humans. Some of the toxicological manifestations of potato glycoalkaloids involve gastrointestinal upsets and neurological disorders especially in doses in excess of 20mg/100g of sample. Values of alkaloids in the Triticum durum wheat samples ranged as follows (mg/100g): 25.7 (raw) > 23.9 (fermented) > 23.3 (germinated) showing marginal processing effects. The CV% was low at 5.14.
3.3.6. Flavonoid
Flavonoids are structurally diverse secondary metabolites in plants, with a multitude of functions. These span from functions in regulating plant development, pigmentation, and UV protection, to an array of roles in defence and signaling between plants and microorganisms. The pigments that colour most flowers, fruits and seeds are flavonoids. Flavonoids are classified in six major subgroups: chalcones, flavones, flavonols, flavandiols, anthocyanins and proanthocynidins or condensed tannins and a seventh group is found in some species, the aurones [119,120]. More than 6000 different flavonoids have been identified [121]. The biological functions of flavonoids are linked to their potential cytotoxicity and their capacity to interact with enzymes through protein complexation. Some flavonoids provide stress protection, e.g., acting as scavengers of free radicals such as reactive oxygen species (ROS), as well as chelating metals that generate ROS via the Fenton reaction [122]. Flavonoids are also involved in the resistance to aluminium toxicity in maize [123]. The different flavonoids have diverse biological functions, they include; protection against ultraviolet (UV) radiation and phyto pathogens, signaling during modulation, male fertility, auxin transport, as well as the colouration of flowers as a visual signal that attracts pollinators [124,125,126]. Flavonoids are also responsible for the display of fall colour in many plants, which may protect leaf cells from photo oxidative damage, enhancing the efficiency of nutrient retrieval during senescence [127]. Flavonoid levels in the samples were low at (mg/100g): 8.70 (raw) > 7.10 (fermented) > 6.10 (germinated) with highest value of CV% (17.9). Evidence of beneficial functions of flavonoids in human health and the use of natural compounds for prevention and treatment of different pathologies will continue to elucidate interest in the study of flavonoids.
Table 19: Some antinutrients content (mg/100g) of raw and processed Triticum durum samples from Nigeria.
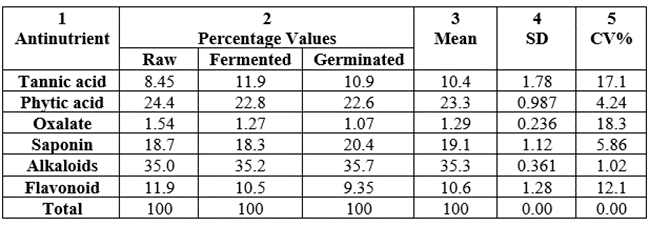
The percentage distribution of the antinutrient values over total values per sample were shown in Table 20. The highest percentage concentration among all samples was alkaloids whose percentage range was 35.0-35.7, followed by phytic acid (22.8-24.4), third position was saponin (18.3-20.4), next was tannic acid (8.45-10.9), closely followed by flavonoid (9.35-11.9) and least percentage was in oxalate (1.07-1.54). The CV% values were generally low at 1.02-18.3.
Table 20: Percentage level of each antinutrient in each sample total antinutrient value of Triticum durum from Nigeria.
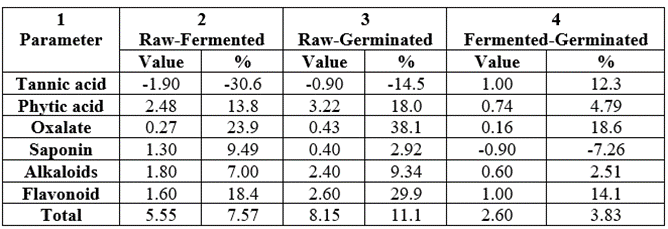
The antinutrient differences (and their percentage differences) between raw-fermented, raw-germinated and fermented-germinated were shown in Table 21. Only tannic acid showed negative values across the board and saponin only in fermented-germinated. The differences observed were due majorly to the fermentation and germination processes on the samples. In column 2, tannic acid (-30.6%) and oxalate (23.9%) exhibited the highest difference; they were oxalate (38.1%) and flavonoid (29.9%) in column 3; whereas highest percentage difference values in column 4 were oxalate (18.6%) and flavonoid (14.1).
Table 21: Differences between the antinutrient values between the raw and processed samples of Triticum durum produced in Nigeria.
The statistical analysis of the data from Table 19 on antinutrients was shown in Table 22. All the rxy values were positive, high and significantly different with range values of 0.9868-0.9958 and the rxy2 values were also high at a range of 0.9738-0.9917. The mean values were low at 10.9-12.2mg/100g with lower values of SD (7.93-8.81) but high levels of CV% (70.2-72.8). All CA values were much lower than IFE: CA (0.0911-0.1619) very less than IFE (0.8381-0.9089), hence low level of error of prediction of relationship. Therefore, functionality interchange between members of each pair would be expected and highly possible and reliable. The critical rxy was 0.01 at n-2 [6-2=4 (df)] and critical value of 0.917.
Table 22: Statistical analysis of the data from Table 19 on antinutrients of raw and processed Triticum durum produced in Nigeria.
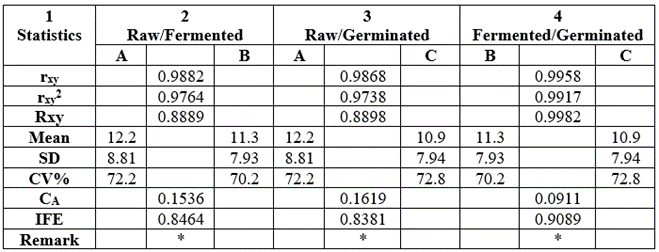
All rxy values were significant when rxy was r = 0.01 at n-2=6-2=4 (df) at critical level of 0.917.
3.4. Effect of Fermentation on Nutrients
Removing undesirable food components is essential to their quality improvement. Different techniques such as, soakig, cooking, fermentation, radiation, germination, chemical treatment or a combination of several of these techniques may come as handy instruments for antinutritional disabling [128].
3.4.1. Carbohydrates
The major carbohydrate in cereals and legumes is starch which provides the most calories in developing countries [23]. Fermentation activates starch-hydrolyzing enzymes such as α-amylase and maltase which degrade starch into malto-dextrins and simple sugars [129] respectively.
3.4.2. Protein
The effect of fermentation on proteins has yielded inconsistent results due to various reasons ranging from sample amino acid profile, different experimental designs and study duration. Some studies had reported increase [130,131,132] while others observed decrease [129,130] in protein and /or some amino acids upon fermentation. It will appear that most of these effects may not reflect actual changes but relative changes due to loss of dry matter as a result of microorganisms hydrolyzing and metabolizing carbohydrates and fats as a source of energy [134]. It is also reported that fermenting microorganisms also uses amino acid which could lower the protein content and quality of some fermented food [129,133].
3.4.3. Minerals
Cereals and legumes are the major source of minerals in developing countries where they are widely consumed. Minerals from plant sources have very low bioavailability because they are found complexed with nondigestible materials such as cell wall polysaccharides [135] as well as phytate. The complex matrices in which these minerals are entrapped and bonded are largely responsible for their low bioavailability. Fermentation is one of the processing methods that are applied to free these complexed minerals and make them readily bioavailable [136,133]. The effect of fermentation depends on food composition and that other food components such as dietary fibres may also slow down the accessibility of some minerals. To offset these challenges, germination or incubation of foods with polyphenol oxidase (PPO) or phytase during fermentation may help reduce the tannins or phytates, respectively and thus make minerals bioaccessible [137].
3.4.4. Phytochemicals
Phytochemicals are important plant secondary metabolic products produced in phenylpropanoid biosynthesis and shikimate pathways during the growth of plant [27]. During growth, L-phenylalanine, under the effect of phenylalanine ammonia lyase (PAL) catalyzation, changes into cinnamic acid. From then on, many phenolic components such as caffeic acid, ferulic among others are synthesized [134]. These can later be converted into tannins, flavonoids, lignins and other compounds. Advances in research have revealed importance of these phytonutrients to human health by virtue of their antioxidant properties [27], cholesterol-lowering effect [138] and reduction in the production of pro-inflammatory cytokines and immunosuppressive cells [139]. Fermentation has significant effect on phytochemicals that are both beneficial and adverse. The ability of fermentation to increase antioxidant properties of foods can be explored as a cost-effective way to reduce oxidative stress within the body after consuming such foods. Fermentation increased the tannic acid of the sample by 30.6%.
3.5. Effect of Germination on Nutrients
Germination is the process that occurs at the beginning of the development of seeds into plants, during which they sprout [25]. It involves changes in the nutritional, biochemical and sensory characteristics of the food. It is used in processing of cereals to improve nutritional quality as it results in reduction of antiutritional factors [140,26,141]. These changes are greatly associated with the activation of some endogenous enzymes making germinated foods higher in nutritional quality compared to nongerminated seeds [27].
3.5.1. Carbohydrates
Germination facilitates the enzymatic breakdown of carbohydrates into simple sugars through activation of endogenous enzymes such as α-amylase thereby improving digestibility [26] as a result of degradation of starch to provide energy for the seed development [27]. Germinating white sorghum for 24 and 36 h resulted into a decrease in carbohydrates and increase in simple sugars [142]. Germination increased the digestibility of starch, making it a good method in the preparation of complementary and infant foods [144,145].
3.5.2. Proteins
The actual protein content will be determined by net effect of synthesis and breakdown. Overall, it seems the net protein synthesis outweighs breakdown due to critical need for synthesis of nucleic acids required for growth, which can influence a net increase in proteins [146]. After germination of buckwheat for 72h, protein content increased significantly [27] probably due to higher rate of protein synthesis compared to proteolysis.
3.5.3. Minerals
It has been hypothesized that the remarkable increase in phytase activity during germination helps reduce phytic acids, which bind minerals subsequently leading to increased minerals availability [147]. A study carried out on buckwheat [27] showed that phytic acid in buckwheat decreased with increase in the germination time due to activation of phytase which hydrolyzes phytic acid into phosphoric acid and myoinositol thereby making minerals more bioavailable [148,149].
3.5.4. Phytochemicals
Germination of buckwheat increases total phenolics, flavonoid and undensed tannin contents [27]. PAL, the enzyme that catalyzes the pathway responsibe for biosynthesis of the different phytochemicals, is responsible for limiting the rate of biosynthesis of phenolic acids and flavonoids. Tang and Zhao [150] concluded that PAL activity is enhanced during the process of germination. This may however not hold for all samples.
3.6. Hypotheses
The results of the null hypotheses are as shown below
3.6.1. Proximate Composition
The statistical analysis showed that the pairs of raw/fermented (A/B), raw/germinated (A/C) and fermented/germinated (B/C) were significantly different at rxy = 0.01; hence the null hypotheses was rejected.
3.6.2. Mineral Composition
Here, A/B, A/C and B/C had significant differences since rxy(C) > rxy(T) in each pair thereby rejecting the null hypothesis; rxy = 0.01.
3.6.3. Mineral Molar Ratios
Under this observation, A/B, A/C and B/C had significantly differences within each pair of samples; rxy(C) being greater than rxy(T) at rxy = 0.01and n-2(df). Null hypothesis was rejected.
3.6.4. Antinutrients Composition
Correlational values showed that significant differences occurred with the pairs of A/B, A/C and B/C at rxy = 0.01 and n-2(df); null hypothesis was rejected.
For ease of reference, raw fermented, germinated samples would mostly be represented as A, B, C respectively. In the proximate composition values, C (21.0g/100g) > A(19.3g/100g) in protein; in the carbohydrate, B (62.2g/100g) > A (61.9g/100g); in moisture content, A (8.54g/100g) > C (8.94g/100g) < B> B (3.39g/100g) > A (3.31g/100g) and in energy (kcal/100g), values were B(356.11) > C (355.81) > A (354.59). On the whole for the proximate composition, the followings were observed: B>A 5⁄7 or 71.4% parameters); C > A (4⁄7 or 57.1% parameters); C > B (3⁄6 or 50.0% parameters since total parameters of C≡B). Between the total lipid (crude fat CF) and the total was true fatty acid (T-TFA), the observation was A C (242.21) > B (241.59) showing evidence of microbial usage of the minerals. In minerals concentration differences and their percentages, 88% parameters in B>A, due to enhancement of Na, K, Ca, Mg, Zn, P; total mineral differences/percentages in B>C (55.6%), C>B (44.4%), C>A (77.8%; Fe (5.07, A) > 4.49 (B) < 4> MSI(C) but this can be mitigated by using the samples to supplement Zn deficient diets. For the mineral molar ratio techniques used, Zn will be highly bioavailable. The antinutrient values were low and positive nutritionally with the exception of alkaloids. For the choice of treatment to enhance the nutritional quality of Triticum durum, both fermentation and germination processes are recommended and the one to pick eventually will depend on the user or experimenter. In the various correlational, CA and IFE calculations, the followings were observed:
Proximate: A/B, A/C, B/C – each pair was significantly different at rxy = 0.01 and n-2 (df).
Minerals: A/B, A/C, B/C- each pair was significantly different at rxy = 0.01 and n-2 (df).
Minerals Molar Ratios: A/B, A/C, B/C- each pair was significantly different at rxy = 0.01 and n-2 (df).
Antinutrients: A/B, A/C, B/C- each pair was significantly different at rxy = 0.01 and n-2 (df).
CA values – all values were low and far less than IFE values, hence, low error of prediction of relationship between A/B, A/C, B/C.
IFE values- all values were high and far higher than CA values, hence, high reduction in the error of prediction of relationship between A/B, A/C, B/C. This meant that food functionality in the samples would be like this: A B; A C; B C.
Supplementary Materials
No supplementary material were attached.
Funding
This research was self-sponsored.
Acknowledgements
None.
Data Availability statement
The data and materials supporting the conclusions of this study are included within the article.
Conflicts of Interest
The author declares no conflict of interest, financial or otherwise.
Consent for Publication
Not applicable.
Clearly Auctoresonline and particularly Psychology and Mental Health Care Journal is dedicated to improving health care services for individuals and populations. The editorial boards' ability to efficiently recognize and share the global importance of health literacy with a variety of stakeholders. Auctoresonline publishing platform can be used to facilitate of optimal client-based services and should be added to health care professionals' repertoire of evidence-based health care resources.

Journal of Clinical Cardiology and Cardiovascular Intervention The submission and review process was adequate. However I think that the publication total value should have been enlightened in early fases. Thank you for all.

Journal of Women Health Care and Issues By the present mail, I want to say thank to you and tour colleagues for facilitating my published article. Specially thank you for the peer review process, support from the editorial office. I appreciate positively the quality of your journal.

Journal of Clinical Research and Reports I would be very delighted to submit my testimonial regarding the reviewer board and the editorial office. The reviewer board were accurate and helpful regarding any modifications for my manuscript. And the editorial office were very helpful and supportive in contacting and monitoring with any update and offering help. It was my pleasure to contribute with your promising Journal and I am looking forward for more collaboration.

We would like to thank the Journal of Thoracic Disease and Cardiothoracic Surgery because of the services they provided us for our articles. The peer-review process was done in a very excellent time manner, and the opinions of the reviewers helped us to improve our manuscript further. The editorial office had an outstanding correspondence with us and guided us in many ways. During a hard time of the pandemic that is affecting every one of us tremendously, the editorial office helped us make everything easier for publishing scientific work. Hope for a more scientific relationship with your Journal.

The peer-review process which consisted high quality queries on the paper. I did answer six reviewers’ questions and comments before the paper was accepted. The support from the editorial office is excellent.

Journal of Neuroscience and Neurological Surgery. I had the experience of publishing a research article recently. The whole process was simple from submission to publication. The reviewers made specific and valuable recommendations and corrections that improved the quality of my publication. I strongly recommend this Journal.

Dr. Katarzyna Byczkowska My testimonial covering: "The peer review process is quick and effective. The support from the editorial office is very professional and friendly. Quality of the Clinical Cardiology and Cardiovascular Interventions is scientific and publishes ground-breaking research on cardiology that is useful for other professionals in the field.

Thank you most sincerely, with regard to the support you have given in relation to the reviewing process and the processing of my article entitled "Large Cell Neuroendocrine Carcinoma of The Prostate Gland: A Review and Update" for publication in your esteemed Journal, Journal of Cancer Research and Cellular Therapeutics". The editorial team has been very supportive.

Testimony of Journal of Clinical Otorhinolaryngology: work with your Reviews has been a educational and constructive experience. The editorial office were very helpful and supportive. It was a pleasure to contribute to your Journal.

Dr. Bernard Terkimbi Utoo, I am happy to publish my scientific work in Journal of Women Health Care and Issues (JWHCI). The manuscript submission was seamless and peer review process was top notch. I was amazed that 4 reviewers worked on the manuscript which made it a highly technical, standard and excellent quality paper. I appreciate the format and consideration for the APC as well as the speed of publication. It is my pleasure to continue with this scientific relationship with the esteem JWHCI.

This is an acknowledgment for peer reviewers, editorial board of Journal of Clinical Research and Reports. They show a lot of consideration for us as publishers for our research article “Evaluation of the different factors associated with side effects of COVID-19 vaccination on medical students, Mutah university, Al-Karak, Jordan”, in a very professional and easy way. This journal is one of outstanding medical journal.

Dear Hao Jiang, to Journal of Nutrition and Food Processing We greatly appreciate the efficient, professional and rapid processing of our paper by your team. If there is anything else we should do, please do not hesitate to let us know. On behalf of my co-authors, we would like to express our great appreciation to editor and reviewers.

As an author who has recently published in the journal "Brain and Neurological Disorders". I am delighted to provide a testimonial on the peer review process, editorial office support, and the overall quality of the journal. The peer review process at Brain and Neurological Disorders is rigorous and meticulous, ensuring that only high-quality, evidence-based research is published. The reviewers are experts in their fields, and their comments and suggestions were constructive and helped improve the quality of my manuscript. The review process was timely and efficient, with clear communication from the editorial office at each stage. The support from the editorial office was exceptional throughout the entire process. The editorial staff was responsive, professional, and always willing to help. They provided valuable guidance on formatting, structure, and ethical considerations, making the submission process seamless. Moreover, they kept me informed about the status of my manuscript and provided timely updates, which made the process less stressful. The journal Brain and Neurological Disorders is of the highest quality, with a strong focus on publishing cutting-edge research in the field of neurology. The articles published in this journal are well-researched, rigorously peer-reviewed, and written by experts in the field. The journal maintains high standards, ensuring that readers are provided with the most up-to-date and reliable information on brain and neurological disorders. In conclusion, I had a wonderful experience publishing in Brain and Neurological Disorders. The peer review process was thorough, the editorial office provided exceptional support, and the journal's quality is second to none. I would highly recommend this journal to any researcher working in the field of neurology and brain disorders.
Dear Agrippa Hilda, Journal of Neuroscience and Neurological Surgery, Editorial Coordinator, I trust this message finds you well. I want to extend my appreciation for considering my article for publication in your esteemed journal. I am pleased to provide a testimonial regarding the peer review process and the support received from your editorial office. The peer review process for my paper was carried out in a highly professional and thorough manner. The feedback and comments provided by the authors were constructive and very useful in improving the quality of the manuscript. This rigorous assessment process undoubtedly contributes to the high standards maintained by your journal.

International Journal of Clinical Case Reports and Reviews. I strongly recommend to consider submitting your work to this high-quality journal. The support and availability of the Editorial staff is outstanding and the review process was both efficient and rigorous.

Thank you very much for publishing my Research Article titled “Comparing Treatment Outcome Of Allergic Rhinitis Patients After Using Fluticasone Nasal Spray And Nasal Douching" in the Journal of Clinical Otorhinolaryngology. As Medical Professionals we are immensely benefited from study of various informative Articles and Papers published in this high quality Journal. I look forward to enriching my knowledge by regular study of the Journal and contribute my future work in the field of ENT through the Journal for use by the medical fraternity. The support from the Editorial office was excellent and very prompt. I also welcome the comments received from the readers of my Research Article.

Dear Erica Kelsey, Editorial Coordinator of Cancer Research and Cellular Therapeutics Our team is very satisfied with the processing of our paper by your journal. That was fast, efficient, rigorous, but without unnecessary complications. We appreciated the very short time between the submission of the paper and its publication on line on your site.

I am very glad to say that the peer review process is very successful and fast and support from the Editorial Office. Therefore, I would like to continue our scientific relationship for a long time. And I especially thank you for your kindly attention towards my article. Have a good day!

"We recently published an article entitled “Influence of beta-Cyclodextrins upon the Degradation of Carbofuran Derivatives under Alkaline Conditions" in the Journal of “Pesticides and Biofertilizers” to show that the cyclodextrins protect the carbamates increasing their half-life time in the presence of basic conditions This will be very helpful to understand carbofuran behaviour in the analytical, agro-environmental and food areas. We greatly appreciated the interaction with the editor and the editorial team; we were particularly well accompanied during the course of the revision process, since all various steps towards publication were short and without delay".

I would like to express my gratitude towards you process of article review and submission. I found this to be very fair and expedient. Your follow up has been excellent. I have many publications in national and international journal and your process has been one of the best so far. Keep up the great work.

We are grateful for this opportunity to provide a glowing recommendation to the Journal of Psychiatry and Psychotherapy. We found that the editorial team were very supportive, helpful, kept us abreast of timelines and over all very professional in nature. The peer review process was rigorous, efficient and constructive that really enhanced our article submission. The experience with this journal remains one of our best ever and we look forward to providing future submissions in the near future.

I am very pleased to serve as EBM of the journal, I hope many years of my experience in stem cells can help the journal from one way or another. As we know, stem cells hold great potential for regenerative medicine, which are mostly used to promote the repair response of diseased, dysfunctional or injured tissue using stem cells or their derivatives. I think Stem Cell Research and Therapeutics International is a great platform to publish and share the understanding towards the biology and translational or clinical application of stem cells.

I would like to give my testimony in the support I have got by the peer review process and to support the editorial office where they were of asset to support young author like me to be encouraged to publish their work in your respected journal and globalize and share knowledge across the globe. I really give my great gratitude to your journal and the peer review including the editorial office.

I am delighted to publish our manuscript entitled "A Perspective on Cocaine Induced Stroke - Its Mechanisms and Management" in the Journal of Neuroscience and Neurological Surgery. The peer review process, support from the editorial office, and quality of the journal are excellent. The manuscripts published are of high quality and of excellent scientific value. I recommend this journal very much to colleagues.

Dr.Tania Muñoz, My experience as researcher and author of a review article in The Journal Clinical Cardiology and Interventions has been very enriching and stimulating. The editorial team is excellent, performs its work with absolute responsibility and delivery. They are proactive, dynamic and receptive to all proposals. Supporting at all times the vast universe of authors who choose them as an option for publication. The team of review specialists, members of the editorial board, are brilliant professionals, with remarkable performance in medical research and scientific methodology. Together they form a frontline team that consolidates the JCCI as a magnificent option for the publication and review of high-level medical articles and broad collective interest. I am honored to be able to share my review article and open to receive all your comments.

“The peer review process of JPMHC is quick and effective. Authors are benefited by good and professional reviewers with huge experience in the field of psychology and mental health. The support from the editorial office is very professional. People to contact to are friendly and happy to help and assist any query authors might have. Quality of the Journal is scientific and publishes ground-breaking research on mental health that is useful for other professionals in the field”.

Dear editorial department: On behalf of our team, I hereby certify the reliability and superiority of the International Journal of Clinical Case Reports and Reviews in the peer review process, editorial support, and journal quality. Firstly, the peer review process of the International Journal of Clinical Case Reports and Reviews is rigorous, fair, transparent, fast, and of high quality. The editorial department invites experts from relevant fields as anonymous reviewers to review all submitted manuscripts. These experts have rich academic backgrounds and experience, and can accurately evaluate the academic quality, originality, and suitability of manuscripts. The editorial department is committed to ensuring the rigor of the peer review process, while also making every effort to ensure a fast review cycle to meet the needs of authors and the academic community. Secondly, the editorial team of the International Journal of Clinical Case Reports and Reviews is composed of a group of senior scholars and professionals with rich experience and professional knowledge in related fields. The editorial department is committed to assisting authors in improving their manuscripts, ensuring their academic accuracy, clarity, and completeness. Editors actively collaborate with authors, providing useful suggestions and feedback to promote the improvement and development of the manuscript. We believe that the support of the editorial department is one of the key factors in ensuring the quality of the journal. Finally, the International Journal of Clinical Case Reports and Reviews is renowned for its high- quality articles and strict academic standards. The editorial department is committed to publishing innovative and academically valuable research results to promote the development and progress of related fields. The International Journal of Clinical Case Reports and Reviews is reasonably priced and ensures excellent service and quality ratio, allowing authors to obtain high-level academic publishing opportunities in an affordable manner. I hereby solemnly declare that the International Journal of Clinical Case Reports and Reviews has a high level of credibility and superiority in terms of peer review process, editorial support, reasonable fees, and journal quality. Sincerely, Rui Tao.

Clinical Cardiology and Cardiovascular Interventions I testity the covering of the peer review process, support from the editorial office, and quality of the journal.

Clinical Cardiology and Cardiovascular Interventions, we deeply appreciate the interest shown in our work and its publication. It has been a true pleasure to collaborate with you. The peer review process, as well as the support provided by the editorial office, have been exceptional, and the quality of the journal is very high, which was a determining factor in our decision to publish with you.

The peer reviewers process is quick and effective, the supports from editorial office is excellent, the quality of journal is high. I would like to collabroate with Internatioanl journal of Clinical Case Reports and Reviews journal clinically in the future time.

Clinical Cardiology and Cardiovascular Interventions, I would like to express my sincerest gratitude for the trust placed in our team for the publication in your journal. It has been a true pleasure to collaborate with you on this project. I am pleased to inform you that both the peer review process and the attention from the editorial coordination have been excellent. Your team has worked with dedication and professionalism to ensure that your publication meets the highest standards of quality. We are confident that this collaboration will result in mutual success, and we are eager to see the fruits of this shared effort.

Dear Dr. Jessica Magne, Editorial Coordinator 0f Clinical Cardiology and Cardiovascular Interventions, I hope this message finds you well. I want to express my utmost gratitude for your excellent work and for the dedication and speed in the publication process of my article titled "Navigating Innovation: Qualitative Insights on Using Technology for Health Education in Acute Coronary Syndrome Patients." I am very satisfied with the peer review process, the support from the editorial office, and the quality of the journal. I hope we can maintain our scientific relationship in the long term.

Dear Monica Gissare, - Editorial Coordinator of Nutrition and Food Processing. ¨My testimony with you is truly professional, with a positive response regarding the follow-up of the article and its review, you took into account my qualities and the importance of the topic¨.

Dear Dr. Jessica Magne, Editorial Coordinator 0f Clinical Cardiology and Cardiovascular Interventions, The review process for the article “The Handling of Anti-aggregants and Anticoagulants in the Oncologic Heart Patient Submitted to Surgery” was extremely rigorous and detailed. From the initial submission to the final acceptance, the editorial team at the “Journal of Clinical Cardiology and Cardiovascular Interventions” demonstrated a high level of professionalism and dedication. The reviewers provided constructive and detailed feedback, which was essential for improving the quality of our work. Communication was always clear and efficient, ensuring that all our questions were promptly addressed. The quality of the “Journal of Clinical Cardiology and Cardiovascular Interventions” is undeniable. It is a peer-reviewed, open-access publication dedicated exclusively to disseminating high-quality research in the field of clinical cardiology and cardiovascular interventions. The journal's impact factor is currently under evaluation, and it is indexed in reputable databases, which further reinforces its credibility and relevance in the scientific field. I highly recommend this journal to researchers looking for a reputable platform to publish their studies.

Dear Editorial Coordinator of the Journal of Nutrition and Food Processing! "I would like to thank the Journal of Nutrition and Food Processing for including and publishing my article. The peer review process was very quick, movement and precise. The Editorial Board has done an extremely conscientious job with much help, valuable comments and advices. I find the journal very valuable from a professional point of view, thank you very much for allowing me to be part of it and I would like to participate in the future!”

Dealing with The Journal of Neurology and Neurological Surgery was very smooth and comprehensive. The office staff took time to address my needs and the response from editors and the office was prompt and fair. I certainly hope to publish with this journal again.Their professionalism is apparent and more than satisfactory. Susan Weiner

My Testimonial Covering as fellowing: Lin-Show Chin. The peer reviewers process is quick and effective, the supports from editorial office is excellent, the quality of journal is high. I would like to collabroate with Internatioanl journal of Clinical Case Reports and Reviews.

My experience publishing in Psychology and Mental Health Care was exceptional. The peer review process was rigorous and constructive, with reviewers providing valuable insights that helped enhance the quality of our work. The editorial team was highly supportive and responsive, making the submission process smooth and efficient. The journal's commitment to high standards and academic rigor makes it a respected platform for quality research. I am grateful for the opportunity to publish in such a reputable journal.

My experience publishing in International Journal of Clinical Case Reports and Reviews was exceptional. I Come forth to Provide a Testimonial Covering the Peer Review Process and the editorial office for the Professional and Impartial Evaluation of the Manuscript.

I would like to offer my testimony in the support. I have received through the peer review process and support the editorial office where they are to support young authors like me, encourage them to publish their work in your esteemed journals, and globalize and share knowledge globally. I really appreciate your journal, peer review, and editorial office.

Dear Agrippa Hilda- Editorial Coordinator of Journal of Neuroscience and Neurological Surgery, "The peer review process was very quick and of high quality, which can also be seen in the articles in the journal. The collaboration with the editorial office was very good."

I would like to express my sincere gratitude for the support and efficiency provided by the editorial office throughout the publication process of my article, “Delayed Vulvar Metastases from Rectal Carcinoma: A Case Report.” I greatly appreciate the assistance and guidance I received from your team, which made the entire process smooth and efficient. The peer review process was thorough and constructive, contributing to the overall quality of the final article. I am very grateful for the high level of professionalism and commitment shown by the editorial staff, and I look forward to maintaining a long-term collaboration with the International Journal of Clinical Case Reports and Reviews.

To Dear Erin Aust, I would like to express my heartfelt appreciation for the opportunity to have my work published in this esteemed journal. The entire publication process was smooth and well-organized, and I am extremely satisfied with the final result. The Editorial Team demonstrated the utmost professionalism, providing prompt and insightful feedback throughout the review process. Their clear communication and constructive suggestions were invaluable in enhancing my manuscript, and their meticulous attention to detail and dedication to quality are truly commendable. Additionally, the support from the Editorial Office was exceptional. From the initial submission to the final publication, I was guided through every step of the process with great care and professionalism. The team's responsiveness and assistance made the entire experience both easy and stress-free. I am also deeply impressed by the quality and reputation of the journal. It is an honor to have my research featured in such a respected publication, and I am confident that it will make a meaningful contribution to the field.

"I am grateful for the opportunity of contributing to [International Journal of Clinical Case Reports and Reviews] and for the rigorous review process that enhances the quality of research published in your esteemed journal. I sincerely appreciate the time and effort of your team who have dedicatedly helped me in improvising changes and modifying my manuscript. The insightful comments and constructive feedback provided have been invaluable in refining and strengthening my work".

I thank the ‘Journal of Clinical Research and Reports’ for accepting this article for publication. This is a rigorously peer reviewed journal which is on all major global scientific data bases. I note the review process was prompt, thorough and professionally critical. It gave us an insight into a number of important scientific/statistical issues. The review prompted us to review the relevant literature again and look at the limitations of the study. The peer reviewers were open, clear in the instructions and the editorial team was very prompt in their communication. This journal certainly publishes quality research articles. I would recommend the journal for any future publications.

Dear Jessica Magne, with gratitude for the joint work. Fast process of receiving and processing the submitted scientific materials in “Clinical Cardiology and Cardiovascular Interventions”. High level of competence of the editors with clear and correct recommendations and ideas for enriching the article.

We found the peer review process quick and positive in its input. The support from the editorial officer has been very agile, always with the intention of improving the article and taking into account our subsequent corrections.

My article, titled 'No Way Out of the Smartphone Epidemic Without Considering the Insights of Brain Research,' has been republished in the International Journal of Clinical Case Reports and Reviews. The review process was seamless and professional, with the editors being both friendly and supportive. I am deeply grateful for their efforts.

To Dear Erin Aust – Editorial Coordinator of Journal of General Medicine and Clinical Practice! I declare that I am absolutely satisfied with your work carried out with great competence in following the manuscript during the various stages from its receipt, during the revision process to the final acceptance for publication. Thank Prof. Elvira Farina

Dear Jessica, and the super professional team of the ‘Clinical Cardiology and Cardiovascular Interventions’ I am sincerely grateful to the coordinated work of the journal team for the no problem with the submission of my manuscript: “Cardiometabolic Disorders in A Pregnant Woman with Severe Preeclampsia on the Background of Morbid Obesity (Case Report).” The review process by 5 experts was fast, and the comments were professional, which made it more specific and academic, and the process of publication and presentation of the article was excellent. I recommend that my colleagues publish articles in this journal, and I am interested in further scientific cooperation. Sincerely and best wishes, Dr. Oleg Golyanovskiy.

Dear Ashley Rosa, Editorial Coordinator of the journal - Psychology and Mental Health Care. " The process of obtaining publication of my article in the Psychology and Mental Health Journal was positive in all areas. The peer review process resulted in a number of valuable comments, the editorial process was collaborative and timely, and the quality of this journal has been quickly noticed, resulting in alternative journals contacting me to publish with them." Warm regards, Susan Anne Smith, PhD. Australian Breastfeeding Association.

Dear Jessica Magne, Editorial Coordinator, Clinical Cardiology and Cardiovascular Interventions, Auctores Publishing LLC. I appreciate the journal (JCCI) editorial office support, the entire team leads were always ready to help, not only on technical front but also on thorough process. Also, I should thank dear reviewers’ attention to detail and creative approach to teach me and bring new insights by their comments. Surely, more discussions and introduction of other hemodynamic devices would provide better prevention and management of shock states. Your efforts and dedication in presenting educational materials in this journal are commendable. Best wishes from, Farahnaz Fallahian.

Dear Maria Emerson, Editorial Coordinator, International Journal of Clinical Case Reports and Reviews, Auctores Publishing LLC. I am delighted to have published our manuscript, "Acute Colonic Pseudo-Obstruction (ACPO): A rare but serious complication following caesarean section." I want to thank the editorial team, especially Maria Emerson, for their prompt review of the manuscript, quick responses to queries, and overall support. Yours sincerely Dr. Victor Olagundoye.

Dear Ashley Rosa, Editorial Coordinator, International Journal of Clinical Case Reports and Reviews. Many thanks for publishing this manuscript after I lost confidence the editors were most helpful, more than other journals Best wishes from, Susan Anne Smith, PhD. Australian Breastfeeding Association.

Dear Agrippa Hilda, Editorial Coordinator, Journal of Neuroscience and Neurological Surgery. The entire process including article submission, review, revision, and publication was extremely easy. The journal editor was prompt and helpful, and the reviewers contributed to the quality of the paper. Thank you so much! Eric Nussbaum, MD

Dr Hala Al Shaikh This is to acknowledge that the peer review process for the article ’ A Novel Gnrh1 Gene Mutation in Four Omani Male Siblings, Presentation and Management ’ sent to the International Journal of Clinical Case Reports and Reviews was quick and smooth. The editorial office was prompt with easy communication.

Dear Erin Aust, Editorial Coordinator, Journal of General Medicine and Clinical Practice. We are pleased to share our experience with the “Journal of General Medicine and Clinical Practice”, following the successful publication of our article. The peer review process was thorough and constructive, helping to improve the clarity and quality of the manuscript. We are especially thankful to Ms. Erin Aust, the Editorial Coordinator, for her prompt communication and continuous support throughout the process. Her professionalism ensured a smooth and efficient publication experience. The journal upholds high editorial standards, and we highly recommend it to fellow researchers seeking a credible platform for their work. Best wishes By, Dr. Rakhi Mishra.

Dear Jessica Magne, Editorial Coordinator, Clinical Cardiology and Cardiovascular Interventions, Auctores Publishing LLC. The peer review process of the journal of Clinical Cardiology and Cardiovascular Interventions was excellent and fast, as was the support of the editorial office and the quality of the journal. Kind regards Walter F. Riesen Prof. Dr. Dr. h.c. Walter F. Riesen.

Dear Ashley Rosa, Editorial Coordinator, International Journal of Clinical Case Reports and Reviews, Auctores Publishing LLC. Thank you for publishing our article, Exploring Clozapine's Efficacy in Managing Aggression: A Multiple Single-Case Study in Forensic Psychiatry in the international journal of clinical case reports and reviews. We found the peer review process very professional and efficient. The comments were constructive, and the whole process was efficient. On behalf of the co-authors, I would like to thank you for publishing this article. With regards, Dr. Jelle R. Lettinga.

Dear Clarissa Eric, Editorial Coordinator, Journal of Clinical Case Reports and Studies, I would like to express my deep admiration for the exceptional professionalism demonstrated by your journal. I am thoroughly impressed by the speed of the editorial process, the substantive and insightful reviews, and the meticulous preparation of the manuscript for publication. Additionally, I greatly appreciate the courteous and immediate responses from your editorial office to all my inquiries. Best Regards, Dariusz Ziora

Dear Chrystine Mejia, Editorial Coordinator, Journal of Neurodegeneration and Neurorehabilitation, Auctores Publishing LLC, We would like to thank the editorial team for the smooth and high-quality communication leading up to the publication of our article in the Journal of Neurodegeneration and Neurorehabilitation. The reviewers have extensive knowledge in the field, and their relevant questions helped to add value to our publication. Kind regards, Dr. Ravi Shrivastava.

Dear Clarissa Eric, Editorial Coordinator, Journal of Clinical Case Reports and Studies, Auctores Publishing LLC, USA Office: +1-(302)-520-2644. I would like to express my sincere appreciation for the efficient and professional handling of my case report by the ‘Journal of Clinical Case Reports and Studies’. The peer review process was not only fast but also highly constructive—the reviewers’ comments were clear, relevant, and greatly helped me improve the quality and clarity of my manuscript. I also received excellent support from the editorial office throughout the process. Communication was smooth and timely, and I felt well guided at every stage, from submission to publication. The overall quality and rigor of the journal are truly commendable. I am pleased to have published my work with Journal of Clinical Case Reports and Studies, and I look forward to future opportunities for collaboration. Sincerely, Aline Tollet, UCLouvain.

Dear Ms. Mayra Duenas, Editorial Coordinator, International Journal of Clinical Case Reports and Reviews. “The International Journal of Clinical Case Reports and Reviews represented the “ideal house” to share with the research community a first experience with the use of the Simeox device for speech rehabilitation. High scientific reputation and attractive website communication were first determinants for the selection of this Journal, and the following submission process exceeded expectations: fast but highly professional peer review, great support by the editorial office, elegant graphic layout. Exactly what a dynamic research team - also composed by allied professionals - needs!" From, Chiara Beccaluva, PT - Italy.

Dear Maria Emerson, Editorial Coordinator, we have deeply appreciated the professionalism demonstrated by the International Journal of Clinical Case Reports and Reviews. The reviewers have extensive knowledge of our field and have been very efficient and fast in supporting the process. I am really looking forward to further collaboration. Thanks. Best regards, Dr. Claudio Ligresti

Dear Chrystine Mejia, Editorial Coordinator, Journal of Neurodegeneration and Neurorehabilitation. “The peer review process was efficient and constructive, and the editorial office provided excellent communication and support throughout. The journal ensures scientific rigor and high editorial standards, while also offering a smooth and timely publication process. We sincerely appreciate the work of the editorial team in facilitating the dissemination of innovative approaches such as the Bonori Method.” Best regards, Dr. Giselle Pentón-Rol.