AUCTORES
Globalize your Research

Research Article | DOI: https://doi.org/10.31579/2637-8914/022
1Faculty of Medicine, Institute of Health and Society, University of Oslo, Norway, Box 1130 Blindern , 0318 Oslo, Norway, Telephone: +47 22844629.
2Department of Animal and S Aquacultural Sciences, The Norwegian University of Life Sciences, Box 5003, 1432 Ås, Norway; Telephone: +47 67232664.
*Corresponding Author: Arne Torbjørn Høstmark, Faculty of Medicine, Institute of Health and Society, University of Oslo, Norway.
Citation: Høstmark AT., Haug A., (2020) Relative Amounts of Eicosanoid and Docosanoid Precursor Fatty Acids Are Positively Associated: A Distribution Dependent Regulation. J Nutrition and Food Processing, 3(1);DOI:10.31579/2637-8914/022
Copyright: © 2020. Arne Torbjørn Høstmark. This is an open-access article distributed under the terms of the Creative Commons Attribution License, which permits unrestricted use, distribution, and reproduction in any medium, provided the original author and source are credited.
Received: 13 January 2020 | Accepted: 27 January 2020 | Published: 03 February 2020
Keywords: arachidonic acid; eicosapentaenoic acid; docosahexaenoic acid; dihomo-gammalinolenic acid; chickens; random numbers; muscle fat; chickens
We recently reported a positive association between %EPA (20:5 n3) and %AA (20:4 n6) in muscle lipids of chickens. In the present work we investigate whether relative amounts of other fatty acids, which are precursors of eicosanoids and docosanoids, might also be positively correlated. The present results seem to verify this suggestion. Furthermore, the correlation outcome might be explained by the particular concentration distributions of the fatty acids under investigation. Thus, similar results were obtained using true values and substitute, random numbers for the fatty acids, sampled with the true ranges. Additionally, when we hypothetically altered distributions in computer experiments, we observed appreciable changes in the strength of the associations. Thus, there seems to be Distribution dependent positive associations between eicosanoid and docosanoid fatty acid precursor percentages, possibly serving to ensure that effects of important regulatory molecules in physiology will be balanced. We suggest that Distribution Dependent Correlations could be a novel evolutionary regulatory principle.
Fatty acids in blood and tissues are important in health and disease, and body amounts are influenced by diet [1-3]. Poly-unsaturated fatty acids with 20 or 22 carbon atoms serve as precursor molecules for physiologically important regulatory molecules, i.e. the eicosanoids and docosanoids, which are produced in most organs and cell types, in reactions catalyzed by cyclooxygenases, lipoxygenases, and epoxygenases [4]. It is well known that EPA (20:5 n3) and AA (20:4 n6) are metabolic antagonists [1 -3]. Eicosanoids derived from EPA may decrease inflammatory diseases [5, 6], improve coronary heart diseases [7, 8], and cancer [9], although a systematic Cochrane Review of selected studies questioned the beneficial effects of long-chain n3 fatty acids on all-cause and cardiovascular mortality [10].
When considering the beneficial health effects of foods rich in EPA, many of the positive effects would be anticipated if the fatty acid works to counteract effects of AA. This latter fatty acid is formed in the body from linoleic acid (LA, 18:2 n6), a major constituent in many plant oils, and is converted by cyclooxygenase and lipoxygenase into various eicosanoids, i.e. prostaglandins, prostacyclin, thromboxane, and leukotrienes [1,2]. AA derived thromboxane A2 (TXA2) and leukotriene B4 (LTB4) have strong proinflammatory and prothrombotic properties, and are involved in allergic reactions and bronchoconstriction [1, 2, 4]. Furthermore, endocannabinoids, which are derived from AA, may have a role in adiposity and inflammation [11]. Additionally, it has been reported that a decreased level of the serum EPA/AA ratio was a risk factor for cancer death in the general Japanese population [9]. However, not only the eicosanoids, but also docosanoids, originating from C22 fatty acids (DPA, DHA), have strong metabolic effects. Among these latter compounds are protectins, resolvins, and maresins, which may strongly counteract immune- and inflammatory reactions [4]. Also eicosatrienoic acid, i.e. 20:3 n6 (dihomo-gammalinolenic acid, DGLA) may serve as precursor for eicosanoids [4]. However, to our knowledge, there are less data on eicosanoids derived from three other C20 fatty acids: the two eicosatrienoic acids 20:3 n3 and 20:3 n9 (Mead acid, not detected in the present work), and eicosadienoic acid (20:2 n6).
In order to achieve a balance between the metabolic influences of the many eicosanoids and docosanoids, we would expect a coordinated regulation of precursor fatty acid percentages, e.g. of % EPA, %AA, %DGLA, and of other relevant fatty acid percentages. Indeed, we might expect in general that these particular percentages of the total sum of fatty acids were positively associated, so that an increase (decrease) in e.g. %AA would be accompanied by a concomitant increase (decrease) in other fatty acid precursor percentages as well, in order to obtain the required balance. We previously reported that that %AA, %EPA, and %DHA were positively associated in breast muscle lipids of chickens [12, 14]. We also showed that this correlation outcome was related to the particular concentration distributions of the fatty acids, as suggested by similar outcomes with true values and surrogate random numbers, however sampled with the true ranges [13 -17]. Furthermore, experimentally altering the ranges in computer experiments strongly influenced the correlation outcomes. The aim of the present work was to further investigate whether relative amounts of eicosanoid and docosanoid precursor fatty acids are positively associated, and whether the correlations are related to the concentration distributions.
Chickens and Diet
We refer to a previous article [18] for details concerning the diet trial. In brief, from day 1 to 29 one-day-old Ross 308 broiler chickens from Samvirkekylling (Norway) were fed wheat-based diet containing 10 g fat per 100 g diet. ALA (18:3 n3), a precursor of EPA, provided 15% of the fatty acids, and LA (18:2 n6), a precursor of AA, provided 21%. The n6/n3 ratio was 1.4. Energy content of the feed was about 19 MJ/ kg. ALA provided 2.5% of the energy, and LA 4%. Other components in the feed were: Histidine 0.1%, choline chloride 0.13%, mono-calcium phosphate 1.4%, ground limestone 1.3%, sodium chloride 0.25%, sodium bicarbonate 0.2%, vitamin A, E, D, K, B 0.18%, L-lysine 0.4%, DL-methionine 0.2%, and L-threonine 0.2%.
Calculations and Statistical Analysis
Correlations. The following 22 fatty acids were determined in chicken breast muscle lipids: 14:0; 14:1; 15:0; 16:0; 16:1; 17:0; 18:0; 18:1 t6,11; 18:1 c9; 18:2 c11; 18:2 n6; 20:0; 18:3 n6; 18:3 n3; 20:1 n9; 20:2 n6; 20:3 n6; 20:3 n3; 20:4 n6; 20:5 n3; 22:6 n3; and 22:5 n3. The sum (S) of all these fatty acids (SD), i.e. 8.85 (2.62) g/kg wet weight (n = 163) was used in the denominator when calculating relative amounts of the fatty acids. For example, percentage arachidonic acid was computed as:
%AA = (AA/S)*100, and % EPA = (EPA/S)*100.
To obtain percentage amounts of other fatty acids, the calculation procedure was as shown for AA and EPA. With all fatty acids serving as potential precursors for eicosanoids and docosanoids, we computed correlation coefficients (Pearson’s r and/or Spearman’s rho) to assess associations between the fatty acid percentages. The following 7 precursor fatty acids were investigated: 20:4 n6, 20:3 n6, 20:3 n3, 20:2 n6, 22:5 n3, 20:5 n3, and 22:6 n3. We additionally made scatterplots to illustrate associations between relative amounts of these fatty acids, but only some examples are included in this work.
Calculations Performed To Possibly Explain the Correlation Outcome
Range and variability.
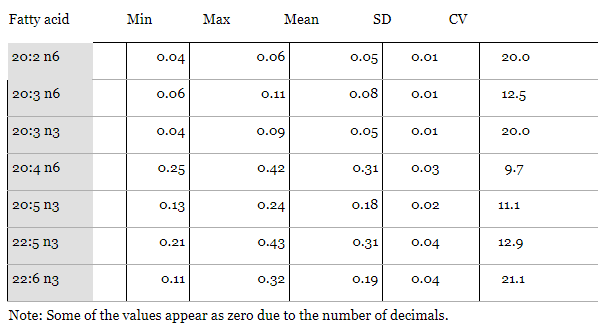
We computed ranges, mean values, and variabilities (coefficient of variation, SD) of the fatty acids under investigation. For example, the range was 0.13 - 0.24 g/kg for EPA, and 0.25 - 0.42 g/kg for AA. To further examine concentration (g/kg) distributions of the various fatty acids, we made histograms; only some examples are shown.
To understand how associations between fatty acid percentages are brought about, we previously simplified the analyses by considering 3 variables only, i.e. the two fatty acids under investigation, and sum (R) of the remaining fatty acids. For example, R = S – DPA – DGLA, if DPA (22:5 n3) and DGLA (20:3 n6) are the fatty acids under investigation. Thus, %DPA + %DGLA + %R = 100, or %DPA = -%DGLA + (100 -%R). With high %R-values, this equation will approach %DPA = %DGLA, showing a positive association between relative amounts of the variables; with a positive slope determined by the ranges of DPA and DGLA, as explained in more detail previously [13 -17]. A similar reasoning is valid when considering the association between relative amounts of all other fatty acids. We present further details under Results and Discussion.
Are the correlation outcomes related to distributions of the fatty acids? A random number approach.
As reported previously [13, 14], with AA and EPA the distribution per se seems to be crucial for the correlation outcome between the fatty acid percentages. If this conclusion is valid for the current analyses as well, we should anticipate similar correlation results with true and surrogate, random numbers for the fatty acids, however sampled with the true concentration ranges. Furthermore, the strength of the associations should be changed if we altered the distributions. We accordingly generated uniformly distributed RANDOM numbers with the physiological distributions of the couple of fatty acids under investigation, and of R. Since the diet trial had 163 birds, for each of the analyses below we generated 163 random numbers with the particular fatty acid distributions shown in Table 1. To clarify, we use upper case letters (RANDOM) or quotation marks in Figures or figure texts when working with random numbers.
Using random numbers in a previous computer experiment, we suggested [15] that, with 3 positive scale variables, two of which having low-number distribution, and low variability, as compared with the third variable, we might expect a positive association between relative amounts of the two low-number variable, and a negative association between percentage high-number variable and each of the low-number variable percentages. Furthermore, a decrease (increase) in the variability of either or both of the two low-number variables seemed to improve (make poorer) the association between their relative amounts. In contrast, a narrowing (broadening) of the distribution of the high-number variable seemed to make poorer (improve) the association between the two low-number variable percentages.
In the present work, it seems that we have two low-number variables (the pair of fatty acids under investigation) relative to a high-number variable (R). Therefore, the previous rules should apply for the current analyses. Thus, R is sum of the remaining fatty acids when omitting the two fatty acids that were under correlation analysis, i.e. R = S – A – B, if S is the total sum of fatty acids, whereas A and B are the fatty acids under investigation. This means that
%A + %B + %R =100, or %B = -%A + (100 -%R).
Conceivably, R should be different for each of the calculations, since different pairs of fatty acids were used. It turned out, however, that variation in R was small, due to great similarity between the ranges of the low-number fatty acids under investigation; the R variability was generally 5 -15 g/kg. We used the range 5 -15 for R in some computer experiments to investigate whether we might obtain the same correlation outcome with true values and random numbers, sampled with the true ranges. However, we used the true R-ranges when computing correlations shown in Table 3.
Additionally, by experimentally changing ranges with hypothetical values in computer experiments, we aimed at further clarifying whether the concentration ranges do govern the association between particular fatty acid percentages of the same sum. Since there are infinite many ways to change the distributions, we limit our analyses to narrowing or broadening of the physiological distributions. For each analysis, we made several repeats with new sets of random numbers; the general outcome of the repeats was always the same, but the correlation coefficients (Pearson’s r and/or Spearman’s rho), and scatterplots, varied slightly. We present the results as correlation coefficients, scatterplots, and regression analyses. SPSS 26.0 was used for the analyses, and for making figures. The significance level was set at p<0.05. The experimental conditions are presented in more detail under “Results and Discussion”.
Descriptive Data
The 7 fatty acids under investigation had in general low numbers, and low variability (Table 1).
Table 1. Descriptive data for the 7 fatty acids under investigation: minimum and maximum values, means (g/kg), with SD, and variability, CV = (SD/mean)*100).
Will we obtain similar associations with true and random numbers for the fatty acids?
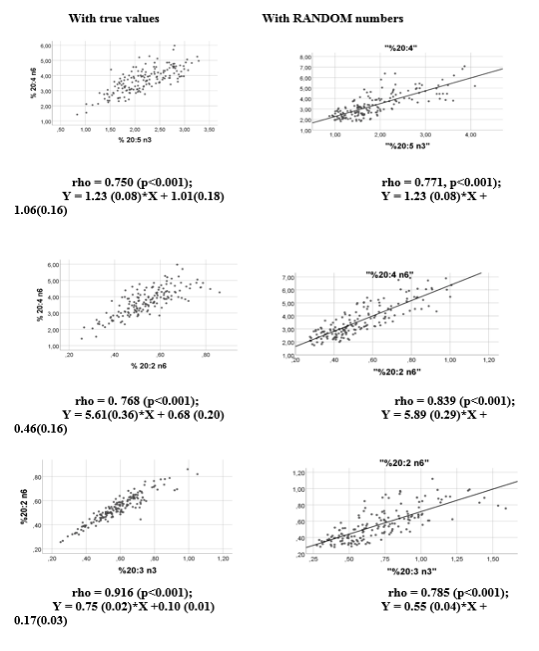
We previously reported a positive association between %EPA and %AA; the outcomes were similar with true values and with surrogate, random numbers, provided that the numbers were sampled with the true ranges for the fatty acids [13]. A repeat of one of these analyses (with a new set of random numbers) is shown in Figure 1, upper panel. In the repeat analysis (Figure 1, top panels) we found that the regression lines were very similar when using true values and random numbers; the equations being y = 1.23 (0.08)*x + 1.01(0.18) with true values (top, left panel), and y = 1.23 (0.08)*x + 1.06(0.16) with random numbers (top, right panel). In Figure 1, middle and lower panels, we present two other examples among the altogether 42 possible scatterplots.
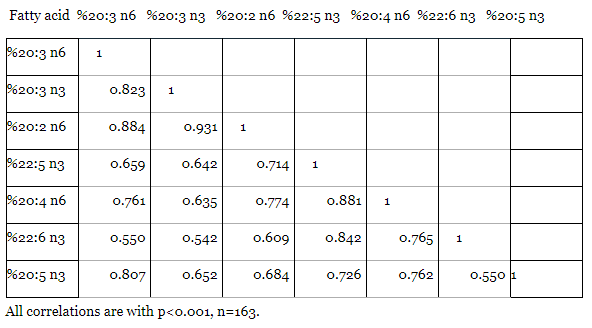
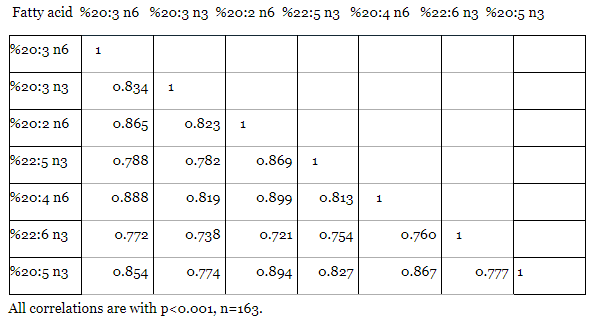
A correlation analysis showed that relative amounts of all of the selected 7 precursor fatty acids for eicosanoids and docosanoids correlated positively with high significance (Table 2). However, as shown in Table 3 we also obtained positive correlations when replacing the true values with RANDOM numbers, sampled within the true ranges for the fatty acids (and R, i.e. sum of the remaining fatty acids when omitting the couple under investigation). Indeed, strengths of correlations were comparable to those obtained with true values, as also confirmed by scatterplots (only some examples are shown in Figure 1). These results strongly suggest that distributions per se of the fatty acid concentrations are crucial for the correlation outcomes.
An Algebraic Approach to Explain the Results
The above results raise the question of how to explain why the concentration ranges seem to govern that relative amounts of the selected fatty acids are positively associated.
Some general considerations
We first consider - in general- three positive scale variables, A, B and R, giving %A + %B + %R = 100, i.e.% B = - % A + (100 - % R). This equation has three unknown variables, each of which with a particular distribution (range). It is therefore hard to predict whether or not there is a significant association between relative amounts of e.g. A and B. We may, however, simplify the equation by approximations, so as to involve two variables only. This may be achieved in two particular situations: 1) if the expression (100 -%R) approaches zero, or 2) if %R approaches zero. Thus, if %R consists of high values (close to 100) and the low-number, corresponding values of %A and %R are such that (100% - %R) > %A, then the equation would approach %B = %A, showing a linear positive association between %A and %B. The requirement (100 - %R) > %A is indeed satisfied, sine the remaining value when calculating (100 - %R) would have to be divided between %A and %B. For example, suppose that %R could reach 99%, then the remaining percentage is to be divided between %A and %B. Hence, the slope must be positive.
On the other hand, if %R consists of very small values, we should expect a negative %A vs. %B association, since the equation in this case would approach % B = - % A + 100. Additionally, we might anticipate positive or negative correlations between A and B percentages also within a certain boundary around the above-mentioned conditions, but with poorer outcomes as the above-mentioned conditions are decreasingly complied with. This reasoning raises the question of how far from the “mathematically ideal”, but “physiologically extreme” (if relating the A, B, and C variables to physiologically ones) conditions we may go and still obtain a positive (negative) %B vs. %A association. Furthermore, this reasoning implies that there must be a Turning Point where a positive (negative) correlation between percentages of A and B turns to become negative (positive), as we previously demonstrated in computer experiments [15, 17]. We previously showed that the association between %A and %B was strongly influenced by altering R [16]. However, also changes in the A and/or B ranges should influence correlations between percent A (B, R). Thus, when narrowing the A or B ranges, this means lower values of %A (B). Since %A + %B + %R =100, a decrease in %A (B) must be accompanied by an increase in %R, thereby approaching the above Condition 1), i.e. improving the positive association between %A and %B. Conversely, an increase in A (B) caused increased values of %A (B), and accordingly lower values of %R, would make the %A vs. %B association poorer. A decrease/increase in %A (B) values is obtained by altering the A (B) ranges, see below. Below we will experimentally show these effects, but first we will give a brief comment on the range of R, and the slope of the regression line.
Range of r: the remaining sum when omitting the pairs under investigation.
To explain the correlation outcome, we need the distribution of R (sum of the remaining fatty acids when omitting the two fatty acids being under investigation). Therefore, we calculated R for a large number of pairs. The general outcome is illustrated by the examples shown in Figure 2. Conceivably, the R distribution should not be much different with different pairs of the current fatty acids, since all of them had low-number ranges as compared with the high-number fatty acids included in R (mainly oleic acid with range 1.0 – 8.6 g/kg). This means that values of R (and accordingly also of %R) were not much altered by varying the couple of fatty acids under investigation; the range of was generally close to 5 – 15 g/kg wet weight (Figure 2).

Slope of the regression line
Above we argued that there should be a positive association between %B and %A, if %R values were very high so that the expression (100 - %R) approached zero. However, in this case it is inappropriate to write %B = %A, like Y = X. In the latter case, both the abscissa and the ordinate may have any value on the scale, and the Y vs. X graph would have slope = 1. In contrast to this, %B and % A – values are limited by the B and A distributions (ranges), respectively. A more general equation would be: %B (p - q) = - %A (r - s) + (100 - %R (t – u)) where the subscript parentheses indicate ranges of A, B, and R. The slope of the %B vs. % A regression line will accordingly be determined by the ranges of A (%A) and B (%B). Thus, if A- and also B - have the same distribution (range), then the slope should be close to 1. Indeed, in an experiment with range 0.10 – 0.15 for both A and B, and 1 – 10 for R, we did find slope =1, [15]. With differing ranges for A and B, e.g. for A 0.20 - 0.40, and for B 0.10 – 0.15, and for R 1 - 10, we found that the equation of the regression line was: %B = 0.38 (0.01)* %A + 0.22 (0.10).
Applying the Above Algebraic Approach to Explain the Association between Eicosanoid (Docosanoid) Precursor Fatty Acid Percentages
We apply the above general consideration to understand the current correlation outcome between percentage eicosanoid (docosanoid) precursor fatty acids from breast muscle lipids of chickens. With the 7 fatty acids under investigation, we have 42 (49 – 7) possible bivariate correlations. Of these, we arbitrarily choose one of the pairs shown in Figure 3, i.e. for B in the equation %B = -%A +(100 -%R) we use eicosadienoic acid (20:2 n6) and for A eicosatrienoic acid (20:3 n3); thus, the equation of the regression line would be: %B (0.04-0.06) = - %A (0.04 – 0.09) + (100 - %R (5 - 15)) which is approaching %B(0.04-0.06) = %A(0.04 – 0.09), due to high %R(5 – 15) values, i.e. there should be a positive association between %B and %A, as was also observed (rho about 0.9). Similarly, the observed negative association between %B(0.04-0.06) (or %A(0.04 – 0.09)) and %R(5 – 15) , i.e. rho =-0.951 (-0.887), p<0.001 for both (n =163) may be explained by approximations of the equations 1) %B = -%R +(100 -%A) and 2) %A = -%R + (100 - %B). Eq. 1) may be approximated to %B = - %R + 100, since %A is small compared with %R. Similarly, eq. 2) may be approximated to % A = -%R + 100. Thus, %R should be negatively associated with both %B and %A, as we did observe. A similar way of reasoning should be valid for all of the current 42 correlations. Therefore, we suggest that the concentration distributions alone can explain all of the positive associations observed.
Experiments to further clarify the influence of range upon RANDOM number % 20:3 n3 vs. RANDOM number % 20:2 n6
If the concentration ranges of the fatty acids really determine the strength of the association between their relative amounts, then we should expect that a change in ranges would cause a disturbance in the associations, as suggested by scatterplots and verified by correlation coefficients. We accordingly did some computer experiments where we changed the ranges of two arbitrarily chosen pair of fatty acids, for example eicosadienoic acid (20:2 n6) and eicosatrienoic acid (20:3 n3). As expected, in response to a moderate narrowing of ranges, we obtained that the association between their relative amounts improved (compare the top panels of Figure 3); the improved association was verified by the change in Spearman’s rho, i.e. rho = 0.737 (p <0.001) before narrowing, against rho = 0.918 after narrowing (p <0.001). This outcome was further corroborated by the greatly improved scatterplot obtained after a strong narrowing of the ranges (Figure 3, middle panel, left; rho after narrowing: 0.992 (p <0.001). In contrast to these appreciable improved associations caused by narrowing the ranges of the fatty acids, we observed a much poorer scatterplot between the relative amounts in response to broadening the ranges, as illustrated by the scatterplot (Figure 3, lower panel, right), and by the poorer correlation coefficient (rho = 0.337, p < 0.001).
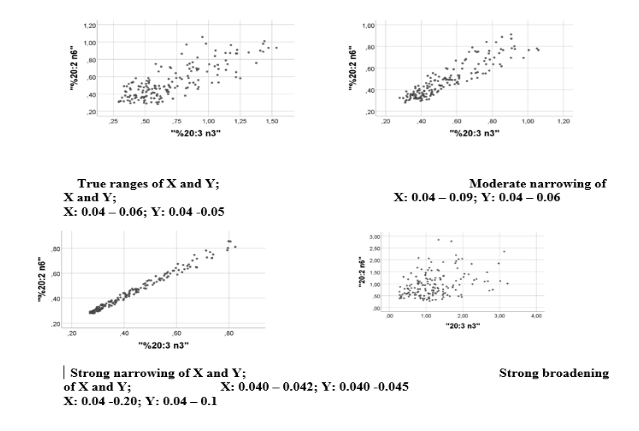
The figure relates to the general eq. %X + %Y + %R = 100, or %Y = -%X + (100 -%R), where X and Y represent various fatty acids, and R is sum of the remaining fatty acids when omitting X and Y, see text. Note that we have used only RANDOM numbers to produce all panels of this figure; the random numbers had uniform distribution and were generated on the basis of the hypothetical ranges shown. We use X for RANDOM number surrogate values of 20:3 n3 and Y for RANDOM numbers of 20:2 n6. The fatty acids appear with quotation marks on the axes, since we apply random number. Upper panel, left: The physiological ranges of X (0.04 - 0.09) and Y (0.04 - 0.06) were used. Spearman’s rho for %Y vs. %X, rho = 0.737, %X (Y) vs. %R, rho = -0.955(-0.894); p<0.001for all, n =163. Quartiles of the %R distribution were: 98.4, 98.9, and 99.1, respectively. Eq. of regression line: y = 0.51 (0.03)*x + 0.18 (0.02). Upper panel, right: Moderate narrowing of ranges: X: 0.04 - 0.06; Y: 0.04 - 0.05.Spearman’s rho for %Y vs. %X, rho = 0.918, % X (Y) vs. %R, rho = -0.981(-0.974); p<0.001for all, n =163. %R quartiles were: 98.6, 99.0, and 99.2, respectively. Eq. of regression line: Y = 0.80 (0.03)*X + 0.05(0.02). Lower panel, left: Effect of a strong narrowing of the ranges; X: 0.040 - 0.042; Y: 0.040 - 0.045. Spearman’s rho for %Y vs. %X: 0.992, % X (Y) vs. %R, rho = -0.998(-0.998); p<0.001for all, n =163. %R quartiles were: 98.9, 99.1, and 99.3, respectively. Effect of an appreciable broadening of the ranges is shown in lower panel, right; X: 0.04 - 0.20; Y: 0.04 - 0.16. Spearman’s rho for %Y vs. %X: 0.337, %X (Y) vs. %R, rho = -0.845(-0.763); p<0.001for all, n =163. %R quartiles were: 97.4, 98.0, and 98.5, respectively. Eq. of the regression line. Y = 0.29 (0.06)*X + 0.61 (0.08). Note: the same range (5 – 15) was used for R in all panels, see text.
Further Details to Explain Figure 3
The scatterplots shown in Figure 3 relate to the general eq. %Y = -%X + (100 -%R), where X and Y represent fatty acids, and R is sum of the remaining fatty acids when omitting X and Y, see text. To produce this figure, we have used RANDOM numbers only; the numbers had uniform distribution and were generated on the basis of the hypothetical ranges shown. We use X for RANDOM number surrogate values of 20:3 n3 and Y for RANDOM numbers of 20:2 n6. The fatty acids appear with quotation marks in the panels, since we apply random number. We first show the outcome with the physiological ranges (Figure 3, upper panel, left) of X (0.04 - 0.09) and Y (0.04 - 0.06); Spearman’s rho for %Y vs. %X: rho = 0.737; %X(Y) vs. %R, rho = -0.955(-0.894); p<0.001for all, n =163. %R quartiles were: 98.4, 98.9, and 99.1, respectively. Equation of the regression line was: y = 0.51 (0.03)*x + 0.18 (0.02). In response to a moderate narrowing of ranges (Figure 3, upper panel, right), i.e. X: 0.04 - 0.06; Y: 0.04 - 0.05, the Spearman’s rho for %Y vs. %X was improved; rho = 0.918; %X (Y) vs. %R, rho = -0.981(-0.974), p<0.001for all, n =163. %R quartiles were: 98.6, 99.0, and 99.2, respectively. Thus, the %R distribution had moved slightly towards higher values, an effect that should improve the association between relative amounts of the surrogate fatty acids, see above. Equation of regression line was: Y = 0.80 (0.03)*X + 0.05(0.02). Effect of a strong narrowing of the ranges; X: 0.040 - 0.042; Y: 0.040 - 0.045 is shown in Figure 3, lower panel, left. Spearman’s rho for %Y vs. %X was further improved: rho = 0.992; %X (Y) vs. %R: rho = -0.998(-0.998); p<0.001for all, n =163. %R quartiles were: 98.9, 99.1, and 99.3, respectively, showing a further minor movement towards higher values of the %R distribution, thereby possibly explaining the improved scatterplot and correlation coefficient (as explained above). Effect of a broadening the ranges is shown in Figure 3, lower panel, right; X: 0.04 - 0.20; Y: 0.04 - 0.16. Spearman’s rho for %Y vs. %X was: 0.337; %X (Y) vs. %R, rho = -0.845(-0.763), p<0.001for all, n =163. %R quartiles were: 97.4, 98.0, and 98.5, respectively. Thus, in line with the above reasoning, in response to a broadening of the X(Y) distribution, we observe a movement of the %R histogram towards lower values. This effect should make the %X vs. %Y association poorer, as illustrated in the scatterplot, and verified by the poorer correlation coefficient. Equation of the regression line after broadening the ranges of X and Y was: Y = 0.29 (0.06)*X + 0.61 (0.08). Note that we use the same range (5 – 15) for R in all panels, as explained above. The strong inverse association between %A(B) and %R is explained by the equation %B = -%A + (100 -%R), which may be approximated to %B = -%R + 100 (showing an inverse %B vs. %R relationship), and by %A = -%R + 100 (showing an inverse %A vs. %R association).
An additional comment on how to explain positive and negative correlations between percentages.
Above we simplified the equation %A + %B + %C = 100, i.e. %B = -%A + (100 -%C), in two ways: 1) by increasing %C to very high values (giving positive correlations), or 2) by decreasing %C to very low values (giving negative correlations). However, the denominator, i.e. (A + B + C) is always there when dealing with percentages, but the significance of C (%C) is quite different in 1) and 2). With positive correlations between %A and %B, C is defined to be very high, thereby governing the denominator, and accordingly also the A and B percentages. Thus, we may approximate to %A = (A/C)*100, and %B = (B/C)*100. Since A and B percentages would both decrease with increasing C-values, it follows that %A and %B will be positively associated. In contrast to this, with negative correlations between %A and %B, C is defined to be very low, making the denominator approach A + B, thereby giving %A = 100*A/(A+B), and %B = 100*B/(A+B). With two variables only, their relative amounts must vary inversely.
Will body weight and body fat influence the present results?
Body weight
When diving the 163 chickens into subgroups according to body weight, we obtained qualitatively the same correlation outcome in in each of the weight subgroups (results not shown). Thus, body weight does not seem to modify the correlations.
Total fat
Body fat (g/kg wet weight) is essentially the sum of all fatty acids. We did not measure fat in other tissues/organs than breast muscle. The possibility exists that the correlation outcome in other tissues/organs might differ from that observed in muscle. The cornerstone of the idea of Distribution Dependent Correlations is that the particular concentration ranges (possibly caused by evolution) of the many fatty acids will ensure that some of their percentages must be positively associated, whereas others are negatively correlated, by mathematical rules. Since even minor changes in ranges may strongly influence the correlations, we might raise the question of how stratifying according to total fat might influence correlations. For example, if we make 3 groups according to amount fat, then the high-fat group would have more than the other groups of e.g. the highest values of oleic acid (OA, 18:1 c9) and ALA (18:3 n3) being major “high-number” fatty acid (OA with range 1.04 – 8.56, and ALA 0.12 -2.40 g/kg). A computer analysis confirmed this reasoning. For example, in the “high-fat group”, OA range was 2.50 -8.56 g/kg, against 1.04 -2.07 g/kg in the “low-fat group”. Corresponding ranges for ALA were 0.55 – 2.40, and 0.12 -0.40 g/kg, respectively.
Thus, in a high-fat subgroup we should have more of e.g. OA and ALA than in the other groups. We apply our previous general equation %A + %B + %R =100, or %B = -%A + (100 - %R), where A and B represent eicosanoid precursor fatty acids, and R is sum of the remaining fatty acids when omitting A and B. With increasing %R, the expression (100 - %R) will move towards zero, thereby favoring a positive %A vs. %B association. Accordingly, in the high-fat group we should obtain increased %R values (since OA and ALA are main R- components); this should improve %A vs. %B association. In line with this reasoning, when dividing the current population into subgroup by amount body fat, we did find improved positive associations, as corroborated by scatterplots and correlation coefficient (not shown). We previously reported that increased OA improved the positive association between %EPA and %AA [16].
Possible physiological interpretations of the results
It is not surprising that percentages of fatty acids may be correlated, since they are all computed from the same sum. Indeed, as early as in 1897 Karl Pearson [19] reported that there will be a spurious correlation between two indexes with the same denominator, even if the variables used to produce the indexes are selected at random with no correlation between them. This general rule raises the question of whether also the present findings represent a correlation bias. Our results show that significant correlations (positive and negative) between percentages of the same sum can indeed be obtained, but not always, and add that range of the variables is essential for the outcome. In our opinion, such correlations may serve as a novel regulatory mechanism in biology, rather than being “spurious correlations”.
Relation to fat intake?
We do not know whether the above correlation outcome, related to amount body fat, might have any physiological significance. One possible interpretation of the results could be that type of dietary fat might influence the associations between eicosanoid and docosanoid precursor percentages, but we do not have direct experimental data to verify this hypothesis.
Distribution Is the Crucial Point
Due to both stimulatory and inhibitory effects of various eicosanoids and docosanoids [2-4], we should expect a balance between their relative amounts. For example, from current knowledge of physiology we would anticipate a positive association between relative amounts of EPA and AA, due to the antagonistic actions of eicosanoids synthesized from these fatty acids [1-4]. It is well known that AA can promote inflammation and thrombosis, and thereby increase the risk of cardiovascular diseases [1-4]. The thromboembolic risk should be decreased by increasing the EPA concentration, thereby lowering percentage AA in platelet phospholipids and subsequently the production of TXA2 and platelet aggregation. In keeping with this, it has been reported that platelet signaling responses are modified by EPA [20].
EPA, AA, DGLA, and DHA may serve as precursor fatty acids for eicosanoids and docosanoids [4]. Hypothetically, our finding that relative amounts of 20:3 n3 and 20:2 n6 as well were positively associated, an effect well explained by their particular concentration distributions, could possibly imply that also these fatty acids give eicosanoids that need to be balanced, but we have no data to substantiate this suggestion. In any instance, the present results suggest that the body might have developed regulatory mechanisms to ensure a proper balance between eicosanoids (docosanoids) having antagonistic metabolic effects. One way to achieve this task could be to regulate the relative amounts of precursor fatty acids for the synthesis of these regulatory molecules, as observed with 7 candidate fatty acids in the present work. Our results indicate that the crucial point in this biological regulation is regulation of the concentration ranges of the precursor molecules: i.e. a Distribution Dependent Regulation. This suggestion is further supported by our finding that alterations in distributions may strongly change associations between relative amounts of the precursor fatty acids, as illustrated in scatterplots and verified by changes in the correlation coefficients. It is tempting to speculate whether a disturbance of this regulation, making the positive association between e.g. %EPA and % AA poor, could possibly increase the risk of AA related conditions and diseases, but we do not have data to corroborate this hypothesis.
Thus, our results lead to the intriguing question of whether evolution might have “chosen” particular concentration ranges for some types of fatty acids, to ensure that percent amounts of some of them must be negatively associated whereas the relative amounts of others are positively correlated. Furthermore, from the results of the present work it is tempting to speculate whether the mathematical rules governing the phenomenon that we have named Distribution Dependent Correlations/ -Regulation might also have relevance in other contexts where associations between relative amounts of the same sum are studied, in biology, physics, chemistry, and in social sciences. Thus, if we know distributions (range, variability), then we may possibly predict whether or not relative amounts are positively or negatively associated, or non-existing.
This work was confined to studying the association between relative amounts of fatty acids being precursors for eicosanoids and docosanoids. We do not know to what extent the suggested phenomenon of Distribution dependent correlations/-regulation is valid for other fatty acids as well. Furthermore, the analyses were based upon fatty acids found in breast muscle lipids of chickens, and we do not know the generalizability of our results, as related to different organs, tissues or compartments, and to various species, including man. Future work in this field should include studies to explore whether the fatty acid distribution might also govern the association between relative amounts of other fatty acids. Comparable studies should be done in other animals and in humans as well.
The present analyses show that relative amounts of fatty acids being precursors of eicosanoids and docosanoids, are positively associated. The positive associations seem to be fully accounted for by the distribution per se of the fatty acid concentrations, suggesting a Distribution Dependent Regulation, possibly serving to balance metabolic effects of various eicosanoids and docosanoids. We speculate whether a disturbance in this type of regulation could increase the risk of e.g. AA associated conditions and diseases.
We thank the collaborators at the Norwegian University of Life Sciences, and at the Animal Production Experimental Center, Ås, Norway, especially Nicole F. Nyquist, Therese Mosti and Malin Andersen.
This work is a spin-off study of a previously published diet trial, conceived and carried out by AH. ATH conceived the present study, did the calculations, statistical analyses, and wrote the article. Both authors participated sufficiently - intellectually or practically - in the work, to take public responsibility for the content of the article. Both authors read and approved the final manuscript.
The diet trial in chickens was performed in accordance with National and international guidelines concerning the use of animals in research (Norwegian Animal and Welfare Act, European Convention for the protection of Vertebrate Animals used for Experimental and other Scientific Purposes, CETS No.: 123 1986). The Regional Norwegian Ethics Committee approved the trial, and the experimental research followed internationally recognized guidelines. There were no competing interests.
Clearly Auctoresonline and particularly Psychology and Mental Health Care Journal is dedicated to improving health care services for individuals and populations. The editorial boards' ability to efficiently recognize and share the global importance of health literacy with a variety of stakeholders. Auctoresonline publishing platform can be used to facilitate of optimal client-based services and should be added to health care professionals' repertoire of evidence-based health care resources.

Journal of Clinical Cardiology and Cardiovascular Intervention The submission and review process was adequate. However I think that the publication total value should have been enlightened in early fases. Thank you for all.

Journal of Women Health Care and Issues By the present mail, I want to say thank to you and tour colleagues for facilitating my published article. Specially thank you for the peer review process, support from the editorial office. I appreciate positively the quality of your journal.

Journal of Clinical Research and Reports I would be very delighted to submit my testimonial regarding the reviewer board and the editorial office. The reviewer board were accurate and helpful regarding any modifications for my manuscript. And the editorial office were very helpful and supportive in contacting and monitoring with any update and offering help. It was my pleasure to contribute with your promising Journal and I am looking forward for more collaboration.

We would like to thank the Journal of Thoracic Disease and Cardiothoracic Surgery because of the services they provided us for our articles. The peer-review process was done in a very excellent time manner, and the opinions of the reviewers helped us to improve our manuscript further. The editorial office had an outstanding correspondence with us and guided us in many ways. During a hard time of the pandemic that is affecting every one of us tremendously, the editorial office helped us make everything easier for publishing scientific work. Hope for a more scientific relationship with your Journal.

The peer-review process which consisted high quality queries on the paper. I did answer six reviewers’ questions and comments before the paper was accepted. The support from the editorial office is excellent.

Journal of Neuroscience and Neurological Surgery. I had the experience of publishing a research article recently. The whole process was simple from submission to publication. The reviewers made specific and valuable recommendations and corrections that improved the quality of my publication. I strongly recommend this Journal.

Dr. Katarzyna Byczkowska My testimonial covering: "The peer review process is quick and effective. The support from the editorial office is very professional and friendly. Quality of the Clinical Cardiology and Cardiovascular Interventions is scientific and publishes ground-breaking research on cardiology that is useful for other professionals in the field.

Thank you most sincerely, with regard to the support you have given in relation to the reviewing process and the processing of my article entitled "Large Cell Neuroendocrine Carcinoma of The Prostate Gland: A Review and Update" for publication in your esteemed Journal, Journal of Cancer Research and Cellular Therapeutics". The editorial team has been very supportive.

Testimony of Journal of Clinical Otorhinolaryngology: work with your Reviews has been a educational and constructive experience. The editorial office were very helpful and supportive. It was a pleasure to contribute to your Journal.

Dr. Bernard Terkimbi Utoo, I am happy to publish my scientific work in Journal of Women Health Care and Issues (JWHCI). The manuscript submission was seamless and peer review process was top notch. I was amazed that 4 reviewers worked on the manuscript which made it a highly technical, standard and excellent quality paper. I appreciate the format and consideration for the APC as well as the speed of publication. It is my pleasure to continue with this scientific relationship with the esteem JWHCI.

This is an acknowledgment for peer reviewers, editorial board of Journal of Clinical Research and Reports. They show a lot of consideration for us as publishers for our research article “Evaluation of the different factors associated with side effects of COVID-19 vaccination on medical students, Mutah university, Al-Karak, Jordan”, in a very professional and easy way. This journal is one of outstanding medical journal.

Dear Hao Jiang, to Journal of Nutrition and Food Processing We greatly appreciate the efficient, professional and rapid processing of our paper by your team. If there is anything else we should do, please do not hesitate to let us know. On behalf of my co-authors, we would like to express our great appreciation to editor and reviewers.

As an author who has recently published in the journal "Brain and Neurological Disorders". I am delighted to provide a testimonial on the peer review process, editorial office support, and the overall quality of the journal. The peer review process at Brain and Neurological Disorders is rigorous and meticulous, ensuring that only high-quality, evidence-based research is published. The reviewers are experts in their fields, and their comments and suggestions were constructive and helped improve the quality of my manuscript. The review process was timely and efficient, with clear communication from the editorial office at each stage. The support from the editorial office was exceptional throughout the entire process. The editorial staff was responsive, professional, and always willing to help. They provided valuable guidance on formatting, structure, and ethical considerations, making the submission process seamless. Moreover, they kept me informed about the status of my manuscript and provided timely updates, which made the process less stressful. The journal Brain and Neurological Disorders is of the highest quality, with a strong focus on publishing cutting-edge research in the field of neurology. The articles published in this journal are well-researched, rigorously peer-reviewed, and written by experts in the field. The journal maintains high standards, ensuring that readers are provided with the most up-to-date and reliable information on brain and neurological disorders. In conclusion, I had a wonderful experience publishing in Brain and Neurological Disorders. The peer review process was thorough, the editorial office provided exceptional support, and the journal's quality is second to none. I would highly recommend this journal to any researcher working in the field of neurology and brain disorders.
Dear Agrippa Hilda, Journal of Neuroscience and Neurological Surgery, Editorial Coordinator, I trust this message finds you well. I want to extend my appreciation for considering my article for publication in your esteemed journal. I am pleased to provide a testimonial regarding the peer review process and the support received from your editorial office. The peer review process for my paper was carried out in a highly professional and thorough manner. The feedback and comments provided by the authors were constructive and very useful in improving the quality of the manuscript. This rigorous assessment process undoubtedly contributes to the high standards maintained by your journal.

International Journal of Clinical Case Reports and Reviews. I strongly recommend to consider submitting your work to this high-quality journal. The support and availability of the Editorial staff is outstanding and the review process was both efficient and rigorous.

Thank you very much for publishing my Research Article titled “Comparing Treatment Outcome Of Allergic Rhinitis Patients After Using Fluticasone Nasal Spray And Nasal Douching" in the Journal of Clinical Otorhinolaryngology. As Medical Professionals we are immensely benefited from study of various informative Articles and Papers published in this high quality Journal. I look forward to enriching my knowledge by regular study of the Journal and contribute my future work in the field of ENT through the Journal for use by the medical fraternity. The support from the Editorial office was excellent and very prompt. I also welcome the comments received from the readers of my Research Article.

Dear Erica Kelsey, Editorial Coordinator of Cancer Research and Cellular Therapeutics Our team is very satisfied with the processing of our paper by your journal. That was fast, efficient, rigorous, but without unnecessary complications. We appreciated the very short time between the submission of the paper and its publication on line on your site.

I am very glad to say that the peer review process is very successful and fast and support from the Editorial Office. Therefore, I would like to continue our scientific relationship for a long time. And I especially thank you for your kindly attention towards my article. Have a good day!

"We recently published an article entitled “Influence of beta-Cyclodextrins upon the Degradation of Carbofuran Derivatives under Alkaline Conditions" in the Journal of “Pesticides and Biofertilizers” to show that the cyclodextrins protect the carbamates increasing their half-life time in the presence of basic conditions This will be very helpful to understand carbofuran behaviour in the analytical, agro-environmental and food areas. We greatly appreciated the interaction with the editor and the editorial team; we were particularly well accompanied during the course of the revision process, since all various steps towards publication were short and without delay".

I would like to express my gratitude towards you process of article review and submission. I found this to be very fair and expedient. Your follow up has been excellent. I have many publications in national and international journal and your process has been one of the best so far. Keep up the great work.

We are grateful for this opportunity to provide a glowing recommendation to the Journal of Psychiatry and Psychotherapy. We found that the editorial team were very supportive, helpful, kept us abreast of timelines and over all very professional in nature. The peer review process was rigorous, efficient and constructive that really enhanced our article submission. The experience with this journal remains one of our best ever and we look forward to providing future submissions in the near future.

I am very pleased to serve as EBM of the journal, I hope many years of my experience in stem cells can help the journal from one way or another. As we know, stem cells hold great potential for regenerative medicine, which are mostly used to promote the repair response of diseased, dysfunctional or injured tissue using stem cells or their derivatives. I think Stem Cell Research and Therapeutics International is a great platform to publish and share the understanding towards the biology and translational or clinical application of stem cells.

I would like to give my testimony in the support I have got by the peer review process and to support the editorial office where they were of asset to support young author like me to be encouraged to publish their work in your respected journal and globalize and share knowledge across the globe. I really give my great gratitude to your journal and the peer review including the editorial office.

I am delighted to publish our manuscript entitled "A Perspective on Cocaine Induced Stroke - Its Mechanisms and Management" in the Journal of Neuroscience and Neurological Surgery. The peer review process, support from the editorial office, and quality of the journal are excellent. The manuscripts published are of high quality and of excellent scientific value. I recommend this journal very much to colleagues.

Dr.Tania Muñoz, My experience as researcher and author of a review article in The Journal Clinical Cardiology and Interventions has been very enriching and stimulating. The editorial team is excellent, performs its work with absolute responsibility and delivery. They are proactive, dynamic and receptive to all proposals. Supporting at all times the vast universe of authors who choose them as an option for publication. The team of review specialists, members of the editorial board, are brilliant professionals, with remarkable performance in medical research and scientific methodology. Together they form a frontline team that consolidates the JCCI as a magnificent option for the publication and review of high-level medical articles and broad collective interest. I am honored to be able to share my review article and open to receive all your comments.

“The peer review process of JPMHC is quick and effective. Authors are benefited by good and professional reviewers with huge experience in the field of psychology and mental health. The support from the editorial office is very professional. People to contact to are friendly and happy to help and assist any query authors might have. Quality of the Journal is scientific and publishes ground-breaking research on mental health that is useful for other professionals in the field”.

Dear editorial department: On behalf of our team, I hereby certify the reliability and superiority of the International Journal of Clinical Case Reports and Reviews in the peer review process, editorial support, and journal quality. Firstly, the peer review process of the International Journal of Clinical Case Reports and Reviews is rigorous, fair, transparent, fast, and of high quality. The editorial department invites experts from relevant fields as anonymous reviewers to review all submitted manuscripts. These experts have rich academic backgrounds and experience, and can accurately evaluate the academic quality, originality, and suitability of manuscripts. The editorial department is committed to ensuring the rigor of the peer review process, while also making every effort to ensure a fast review cycle to meet the needs of authors and the academic community. Secondly, the editorial team of the International Journal of Clinical Case Reports and Reviews is composed of a group of senior scholars and professionals with rich experience and professional knowledge in related fields. The editorial department is committed to assisting authors in improving their manuscripts, ensuring their academic accuracy, clarity, and completeness. Editors actively collaborate with authors, providing useful suggestions and feedback to promote the improvement and development of the manuscript. We believe that the support of the editorial department is one of the key factors in ensuring the quality of the journal. Finally, the International Journal of Clinical Case Reports and Reviews is renowned for its high- quality articles and strict academic standards. The editorial department is committed to publishing innovative and academically valuable research results to promote the development and progress of related fields. The International Journal of Clinical Case Reports and Reviews is reasonably priced and ensures excellent service and quality ratio, allowing authors to obtain high-level academic publishing opportunities in an affordable manner. I hereby solemnly declare that the International Journal of Clinical Case Reports and Reviews has a high level of credibility and superiority in terms of peer review process, editorial support, reasonable fees, and journal quality. Sincerely, Rui Tao.