Research Article | DOI: https://doi.org/10.31579/2690-4861/841
1Conovita Technologies Inc., Winnipeg, Canada.
²Medicentres, Manitoba, Canada.
³British Columbia Institute of Technology (BCIT), Burnaby, B.C., Canada.
*Corresponding Author: Mahnaz Derakhshan, Conovita Technologies Inc., Winnipeg, Canada.
Citation: Mahnaz Derakhshan, Hamid R Ansarian, Mory Ghomshei, (2025), Photoplethysmography Indices and Their Link to Premature Ventricular Complexes on ECG, International Journal of Clinical Case Reports and Reviews, 26(3); DOI:10.31579/2690-4861/841
Copyright: © 2025, Mahnaz Derakhshan. This is an open-access article distributed under the terms of the Creative Commons Attribution License, which permits unrestricted use, distribution, and reproduction in any medium, provided the original author and source are credited.
Received: 16 May 2025 | Accepted: 03 June 2025 | Published: 06 June 2025
Keywords: photoplethysmography; electrocardiogram; ppg waveform indices; blood flow indices
Background: The search for non-invasive and accessible markers of cardiovascular function has driven the exploration of innovative technologies, with photoplethysmography (PPG) emerging as a promising tool. Traditionally used for detecting pulse and oxygen saturation, PPG waveforms also contain valuable information about blood circulation. This single-subject, retrospective signal analysis aimed to investigate the correlation between a set of novel PPG-derived Blood Flow Indices (BFIs) and the occurrence of Premature Ventricular Complexes (PVCs).
Methods: PPG waveforms and corresponding electrocardiograms (ECG) were extracted from a randomly selected individual from the Medical Information Mart for Intensive Care III (MIMIC-III) database. BFIs, including Arterial Blood Ratio (ABR), Arterial Blood Proportion (ABP), Exact Pulsatile Ratio (EPR), Waveform Ratio (WFR), and Average Peak Slope (APS), were calculated from waveforms. Statistical analyses, including Mann-Whitney U tests and the Hodges-Lehmann estimate, assessed differences and correlations between BFIs and PVC occurrence.
Results: The analysis revealed statistically significant differences in the medians of BFIs between the with-PVC and without-PVC groups (p < 0.05). Mann-Whitney U tests confirmed a higher APS and lower ABR, WFR, EPR, and ABP in the with-PVC group (p < 0.0001). Harrell's C-index values (0.77–0.87) indicated a strong discriminatory ability of BFIs to detect PVCs.
Conclusion: These findings suggest that BFIs derived from PPG can reliably differentiate between PVC and non-PVC events, supporting their potential as non-invasive markers.
In cardiovascular health assessment, the Electrocardiogram (ECG) is an indispensable tool, providing clinicians with invaluable insights into the electrical activity of the heart. Among the various signals recorded by ECG, Premature Ventricular Complexes (PVCs) are commonly observed but are often considered benign in many cases.[1] However, research suggests that certain patterns of PVC occurrence may be associated with broader cardiovascular events, including atrial fibrillation, heart failure, and increased cardiovascular risk in specific populations [1–4]. While PVCs themselves may not always be clinically significant, their detection serves as a valuable comparison point for evaluating novel physiological markers.
Recent advancements in cardiovascular monitoring have introduced innovative tools that extend beyond the limitations of conventional ECG methods[5–7] This study explores the potential of a health monitoring system based on blood flow indices to provide cardiovascular insights by analyzing signals obtained from photoplethysmography (PPG). PPG is a well-established optical technique that non-invasively captures microvascular blood volume changes at the skin surface.[8, 9] It is widely used in medical devices to measure oxygen saturation and pulse rate and is also being explored for applications in blood pressure and respiratory rate monitoring. [10–12] However, its full potential in comprehensive cardiovascular assessment, such as detecting hemodynamic alterations and cardiac irregularities, remains underexplored.
The PPG waveform has two main components. The first component is a pulsatile physiological signal associated with cardiac-related blood volume changes synchronized with each heartbeat.[13] The second component is a slowly varying baseline with lower-frequency elements related to respiration, sympathetic nervous system activity, and thermoregulation.[14]Together, these components provide rich physiological information that can be leveraged for various health monitoring applications. In recent years, there has been a notable resurgence of interest in PPG technology, driven by the increasing demand for accessible and portable healthcare solutions in primary care and community-based clinical settings. [15]
In this study, we investigate whether indices derived from PPG waveforms correlate with PVCs detected by ECG. By comparing PPG-derived indices with ECG, which is a critical tool for PVC diagnosis, we aim to assess their potential role in identifying cardiovascular events. These findings could contribute to expanding the clinical applications of PPG beyond its traditional uses, making it a valuable tool in modern healthcare.
We used data from the MIMIC-III Waveform Database Matched Subset, which is linked to the Medical Information Mart for Intensive Care III (MIMIC-III) Clinical Database.[16] This database is matched with deidentified demographic data in the MIMIC III Clinical database. The study was conducted in accordance with Good Clinical Practice (Declaration of Helsinki, 2002), and all necessary ethical approvals were obtained per the guidelines and requirements of the MIMIC-III database. The MIMIC-III project was approved by the Massachusetts Institute of Technology (MIT) and Beth Israel Deaconess Medical Center (BIDMC), and as the data is deidentified, informed consent was not required.
The Matched Subset database waveforms include Electrocardiogram (ECG) [17, 18], respiration, continuous blood pressure, and Photoplethysmography (PPG) signals, all sampled at 125 Hz. A fingertip sensor measured the PPG data. The dataset used in this study was obtained from a randomly selected subject who had synchronized PPG and ECG waveform data. The primary exposure was defined as the presence of a Premature Ventricular Contraction (PVC) event identified on the ECG waveform. We reviewed the 8-minute ECG trace and annotated all PVC occurrences. For each PVC event, we extracted a corresponding 6-second segment of the PPG waveform, beginning 2.4 seconds prior to the PVC peak. These waveform segments constituted the group associated with PVC events. The remaining PPG waveform data (excluding the PVC-associated segments) were partitioned into 6-second segments to form the comparison group, representing non-PVC intervals. Each PPG segment was then analyzed to extract relevant waveform features. The PPG waveform includes two primary components, a pulsatile and a non-pulsative component [19]. As shown in Figure 1, the pulsatile component, recognized as the alternating current (AC) component [20], is in synchrony with the cardiac cycle[12].
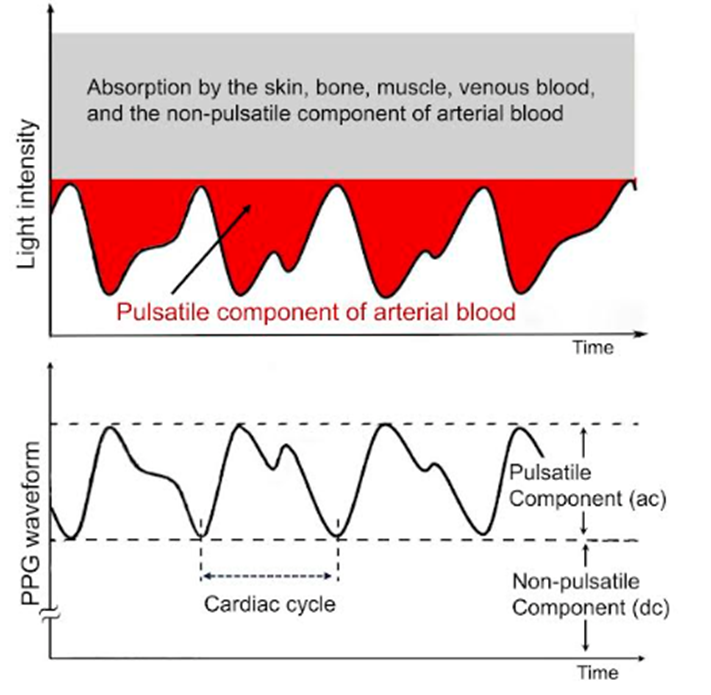
Figure 1: Representative photoplethysmography (PPG) waveform showing the respective pulsatile (AC) and non-pulsatile (DC) components. The AC component reflects the dynamic changes in arterial blood volume during the cardiac cycle, while the DC component includes absorption by skin, muscle, bone, venous blood, and the static portion of arterial blood. Light intensity changes over time are illustrated to demonstrate the relationship between the physiological signals and the PPG waveform.
In this study, the PPG waveform, along with its maximum and minimum values within each segment and each cardiac cycle, was used to establish specific areas for analysis (Figure 2). We calculated the Blood Flow Indices (BFIs) by dividing the respective areas within the waveform or using the periodic slope of the PPG waveform. The statistical analyses were conducted using STATA statistical software, release 17 (College Station, TX: StataCorp LLC, TX, USA).[21]
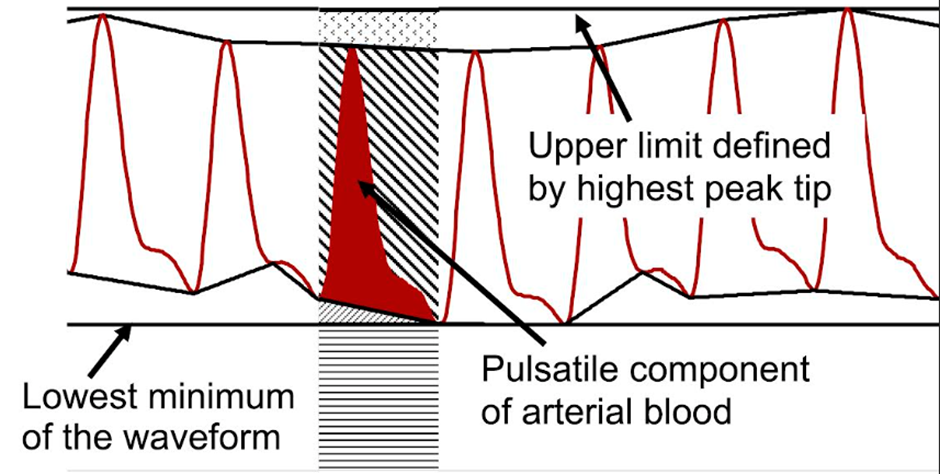
Figure 2: Visualization of photoplethysmography (PPG) waveform areas based on the maximum and minimum values identified within each segment and cardiac cycle. The upper boundary is defined by the highest peak of the pulsatile signal, while the lower boundary is determined by the lowest trough. These points are used to delineate individual waveform segments.
Due to the non-normal distribution of our data, nonparametric statistics were employed for analysis. Blood flow indices (BFIs) were assessed using the Mann-Whitney U test, with results presented as medians and interquartile ranges. The Hodges–Lehmann median difference test [22] was employed to compare the median differences between individual PPG segments in the groups with- and without-PVC. To measure the ability of blood flow indices to predict the presence of PVCs, we calculated Newson’s Harrell's C-index.[23, 24] Statistical significance was determined with a threshold of p-value less-than sign
The waveform dataset of PPG and corresponding ECG was obtained from the MIMIC III matched subset database belonging to a 78-year-old male subject. The dataset consisted of 77 PPG waveform segments. These were divided into two groups based on the presence of PVCs in the corresponding ECG segment. The resulting groups included 18 segments with PVCs and 59 segments without PVCs in their corresponding ECG waveforms. The mean number of PPG peaks in data segments was 8.32 (SD: 0.77). In this study, we incorporated a set of PPG indices that comprehensively analyze the pulsatile component of the PPG waveform. These indices include the Arterial Blood Ratio (ABR), Arterial Blood Proportion (ABP), Exact Pulsatile Ratio (EPR), Waveform Ratio (WFR), and Average Peak Slope (APS). The arterial blood ratio (ABR) was computed by dividing the arterial blood area by its complement within the pulsatile area. Similarly, the arterial blood proportion (ABP) was determined by dividing the arterial blood segment by the sum of the arterial blood area and its complement. The waveform ratio (WFR) was calculated to address low-frequency fluctuations[14] in the PPG waveform. The calculation defined the lower limit as the baseline, determined by the lowest minimum of the waveform, and the upper limit as the tip of the highest peak. The WFR was then computed as the ratio of the area under the waveform to the area above the waveform. The Exact Pulsatile Ratio (EPR) was determined by dividing the pulsatile area, with the exclusion of the impact of low-frequency variations, by the complement area positioned between the waveform and the lower and upper limits established by the low-frequency fluctuations. The Average Peak Slope (APS), the average absolute value of the periodical slope of the PPG waveform, completes this set of indices, collectively offering a nuanced and multi-faceted perspective on the diverse aspects of the pulsatile component within the PPG signal.
The median APS for the entire group was 0.082 (IQR 0.063 - 0.109). The group containing the PPG segments with PVCs in the corresponding ECG waveform (n=18) had a median of 0.122 (IQR 0.100- 0.144), and the median APS for the group of PPG segments without PVCs was 0.075 (IQR 0.060- 0.088) (Figure 3). The entire group's PPG-derived indices presented median values as follows: Arterial Blood Ratio (ABR) 0.47 (0.43-0.49), Waveform Ratio (WFR) 0.56 (0.52-0.62), Exact Pulsatile Ratio (EPR) 2.42 (1.89-2.86), and Arterial Blood Proportion (ABP) 0.32 (0.30-0.33)
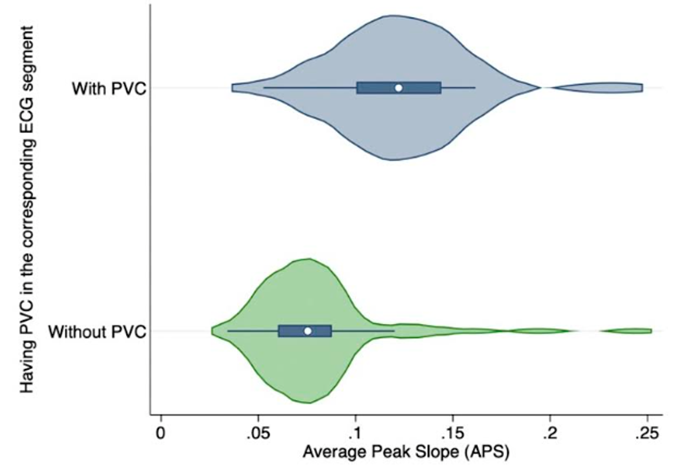
Figure 3: Average Peak Slope (APS) as a representative Blood Flow Index (BFI) in each study group. Although all BFIs were calculated, only the APS is shown in this figure. Comparisons between groups were performed to assess variations in BFI, potentially reflecting differences in vascular function or circulatory status.
The Mann-Whitney U test revealed a statistically significant difference in Average Peak Slope (APS) between the group with PVCs and the group without PVCs (z = -4.45, p less-than sign 0.0001). Notably, the group with PVCs exhibited a higher APS compared to the group without PVCs. We found significant differences between the two groups in other PPG-derived indices as well. The group with PVCs displayed lower values in Arterial Blood Ratio (ABR) (z = 4.65, p less-than sign 0.0001), Waveform Ratio (WFR) (z = 4.35, p less-than sign 0.0001), Exact Pulsatile Ratio (EPR) (z = 3.41, p= 0.0006), and
Arterial Blood Proportion (ABP) (z = 4.65, p less-than sign 0.0001), compared to the group without PVCs.
The Hodges–Lehmann median difference test [22] revealed a statistically significant difference in the medians of Blood Flow Indices (BFIs) between the without-PVC and with-PVC groups. These results confirm the distinct variation in hemodynamic patterns between the two groups, as shown in. [Figure 4] The 95% confidence intervals for the median differences, which do not cross zero, further support this finding. The detailed results are presented in the supporting document.
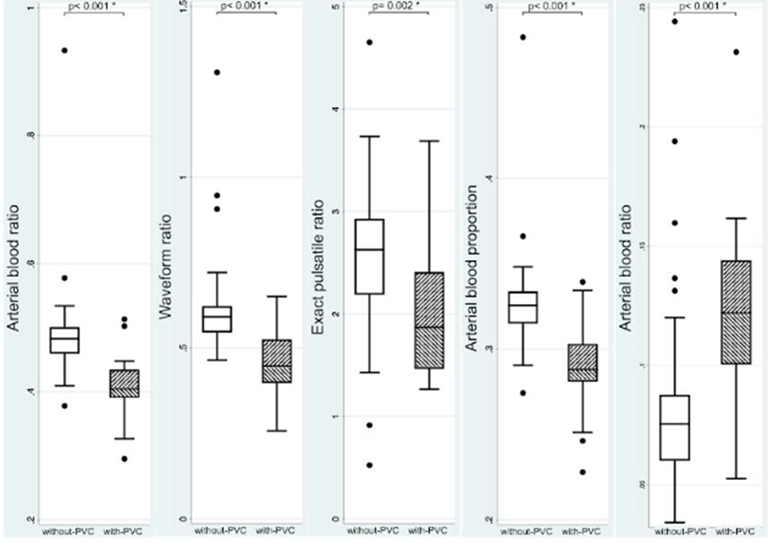
Figure 4: Box plots showing the distribution of Blood Flow Indices (BFIs) in participants with premature ventricular contractions (PVCs, dashed boxes) and without PVCs (white boxes). The comparison illustrates potential hemodynamic differences between the two groups
We calculated Harrell’s C-index using Newson’s method to assess the ability of blood flow indices to predict the presence of PVCs [25]. The results show that, based on a random selection, the probability of an observed average peak slope (APC) in the with-PVC group exceeding that
of the without-PVC group is 85% (Table 1). The probabilities and corresponding confidence intervals for observing lower values of ABR, WFR, EPR, or ABP in the with-PVC group compared to the without-PVC group are also presented in Table 1. The measured C-index values ranged from 0.77 to 0.87.
| Indices | Harrell's C-index | [95% Conf. Interval] | p-Value* |
| ABRa | 0.87 | 0.74 0.99 | p< 0> |
| WFRb | 0.84 | 0.70 0.98 | p< 0> |
| EPRc | 0.77 | 0.64 0.90 | p< 0> |
| ABPd | 0.87 | 0.74 0.99 | p< 0> |
| APSe | 0.85 | 0.74 0.96 | p< 0> |
Table 1: Prediction Ability of Blood Flow Indices: Harrell's C-Index.
a: Arterial blood ratio; b: Waveform ratio; c: Exact pulsatile ratio; d: Arterial blood proportion; e: Average peak slope; *: calculated by Newson Somers' D package.
The findings of our study highlight distinct photoplethysmography (PPG) characteristics between the two groups. The observed differences in the Blood Flow Index (BFI) reflect potential variations in their underlying hemodynamic profiles. Specifically, the higher APS observed in the with-PVC group points to increased variability in the blood flow waveform, indicative of altered circulatory dynamics associated with PVCs.
While PVCs are typically considered electrical disturbances on the electrocardiogram (ECG), they may also exert mechanical effects on cardiac function. Beyond irregular electrical impulses, PVCs can disrupt the coordinated contraction and relaxation of the heart chambers, leading to reduced mechanical efficiency. These mechanical changes are detectable in the PPG waveform, emphasizing the potential of PPG to capture not only electrical but also mechanical abnormalities in cardiovascular function.
Our statistical analyses—including the Mann-Whitney U test and the Hodges–Lehmann median difference test—revealed non-overlapping confidence intervals between the groups, supporting a significant difference in the medians of the blood flow indices. Alongside C-index values ranging from 0.77 to 0.87, well above the random ordering threshold of 0.5, these findings suggest that BFIs have strong discriminatory power for identifying PVC presence. This supports their potential role as effective markers in cardiovascular assessments.
Additionally, the Hodges–Lehmann estimates clarify the typical shift in PPG segment values associated with PVCs. Specifically, it estimates the expected change in PPG segments when a PVC is present in the corresponding electrocardiogram. The statistically significant differences, across all indices, indicate that these metrics can reliably signal the occurrence of PVCs and reinforce the diagnostic potential of BFIs. This finding suggests that the BFIs could play an essential role in monitoring cardiovascular health. Their future integration into routine health monitoring systems may enhance diagnostic and prognostic assessments, particularly for individuals at risk of arrhythmias or other cardiac issues.
A key strength of this study is that the data were collected from a single individual within a defined time frame, minimizing potential confounding factors such as variations in disease state, medication effects, or inter-individual differences. This controlled setting ensures that observed associations between PPG-derived indices and ECG-detected PVCs are not influenced by external physiological variables. However, this also presents a limitation, as the findings may not be directly generalizable to a broader population with diverse cardiovascular conditions and varying physiological characteristics. Future studies involving larger sample sizes and multiple individuals across different clinical backgrounds are necessary to further validate these results, account for inter-individual variability, and better assess diagnostic and prognostic capabilities.
Our study highlights the potential of the PPG indices, such as BFIs, to detect significant physiological changes in cardiovascular function, particularly regarding PVC occurrence. The strong correlation between BFIs and PVCs suggests that these indices could serve as valuable non-invasive tools for cardiac health monitoring. However, further research with larger sample sizes is needed to fully validate their diagnostic and prognostic capabilities. Expanding studies will help refine their clinical applications, enhancing their use in both routine and specialized care settings. The versatility of PPG as a non-invasive modality for assessing cardiovascular health continues to inspire exploration in research and clinical practice. These findings underscore the promise of new approaches for cardiovascular assessment, with potential implications for improving patient outcomes through personalized monitoring strategies.
The authors declare that no financial support or specific funding was received to conduct this research. There are no personal financial interests or professional relationships that could be perceived as influencing the work. The authors are inventors of monitoring apparatuses, systems, and methods using arteriovascular pulse signals.
An additional file containing a supplementary table and figure has been provided alongside the manuscript. Relevant data is available in the associated GitHub repository.
Dear Editorial Team, Clinical Medical Reviews and Reports. My experience with the journal was highly positive. The peer-review process was rigorous, constructive, and completed in a timely manner. The reviewers provided valuable comments that helped improve the quality and clarity of our manuscript. The editorial office was professional, responsive, and supportive throughout all stages of the publication process. Communication was clear and efficient, and any questions were addressed promptly. Overall, I found the journal to maintain high scientific standards and an excellent publication workflow. I would be pleased to consider submitting future work to this journal. Best wishes from, Elena Popa.

It was my pleasure to submit my testimonial concerning the Reviewer Board of our Scientific Journal “Brain and Neurological Disorders”. The Reviewers focused on some modifications and their contribution was helpful. The ladies of our Editorial Office were also supported my efforts. It was my honor to have such a co-operation and I am looking forward for more collaboration.

Dear Grace Pierce, Editorial Coordinator of Journal of Clinical Research and Reports, Thank you for the speedy and efficient peer review process. I appreciate the fact that your peer reviewers do not take months to respond like with some other journals. I would also like to thank the editorial office for responding quickly to my questions. It is an excellent journal. I plan to submit more manuscripts in the future. Best wishes from, Robert W. McGee

Dear Grace Pierce, Editorial Coordinator of Journal of Clinical Research and Reports, Working with you and your team on our recent publication in JCRR has been a truly wonderful and enjoyable experience. The responses were prompt, and the reviewers were patient, constructive, and highly professional. One reviewer in particular gave me the feeling that a professor was carefully reading and commenting on my coursework, which was deeply touching. The entire process was straightforward and hassle‑free, with no tedious online forms to complete. I highly recommend this journal. Best wishes from, DR Aibing Rao, Head of R&D

I Appreciate the Opportunity to Share my Experience with the Journal of Clinical Research and Reports. The peer review process was timely and constructive, and the feedback provided helped improve the quality of our manuscript. The editorial office was professional, responsive, and supportive throughout the process, ensuring smooth communication and efficient handling of the submission. Overall, it was a positive experience collaborating with your team.

Dear Mercy Grace, Editorial Coordinator of Obstetrics Gynecology and Reproductive Sciences, We would like to express our gratitude for your help at all stages of publishing and editing the article. The editors of the magazine answer all the necessary questions and help at every stage. We will definitely continue to cooperate and publish other works in the Obstetrics Gynecology and Reproductive Sciences! Best wishes from, Alla Konstantinovna Politova,